
Summarize this post with AI
Most logistics and 3PL companies can tell you total revenue by customer, and cannot tell you which of those customers actually generate profit once real service costs are allocated properly. Customer profitability analytics exists to close that specific gap. Harvard research on customer profitability, developed alongside activity based costing, has repeatedly found that the most profitable fifth of customers generate between 150% and 300% of a company's total profit, while the least profitable tenth to fifth can lose 50% to 200% of it, with the middle group roughly breaking even. In logistics specifically, where indirect costs from transportation, warehousing, and order management often exceed direct costs, getting that allocation wrong distorts nearly every customer and route decision that follows.
Customer Profitability Analytics:
Customer profitability analytics for logistics and 3PL companies means allocating transportation, warehousing, and order management costs to specific customers and routes based on actual activity consumption, not aggregate volume or revenue share. Academic research applying activity based costing to transportation companies has repeatedly found that traditional volume based costing misranks customer and channel profitability, in one widely cited industry case a channel appearing most profitable under traditional costing ranked lowest once activity based costing was applied. For 3PL companies specifically, where indirect costs frequently exceed direct costs, this distinction determines whether profitability decisions are based on reality or a costing artifact.
What customer and route profitability analytics actually measures
What is a 3PL logistics provider, in the context this analysis matters for? A third party logistics company manages transportation, warehousing, and distribution on behalf of client businesses, meaning its own profitability depends entirely on correctly costing services delivered across many different customers and routes simultaneously. What are 3PL services in logistics? They typically span transportation management, warehousing, order fulfillment, and increasingly value added services like demand planning, each with a different cost profile per customer.
Route profitability measures whether a specific route or lane generates margin once fuel, labor, vehicle costs, and empty return legs are properly allocated, not just whether it carries high volume. Academic case studies applying activity based costing to land transportation companies have found this distinction consistently reveals routes and customers that looked profitable under simpler costing methods were actually eroding margin. Our guide on logistics analytics platforms covers the broader data infrastructure this kind of analysis depends on.
Measure Your AI Readiness with a Free Assessment
Why this matters more for 3PL companies in 2026
Logistics analytics platform adoption has become a genuine competitive necessity for three reasons.
Indirect costs now dominate logistics cost structures. As customer service expectations rise and delivery complexity increases, the proportion of indirect cost, order management, customer service, network coordination, has grown to the point where it can exceed direct transportation cost entirely for many 3PL operations.
Margin pressure has made rough approximations too risky. A customer or route wrongly flagged as profitable under simple volume based costing can continue consuming resources unprofitably for years before the distortion is caught.
TMS, WMS, and ERP data integration has made granular costing achievable. The historical barrier to activity based costing, the labor intensive process of tracking every activity manually, has fallen significantly now that transportation, warehouse, and enterprise systems can feed a costing model directly.
Our overview of why enterprise AI data infrastructure matters covers the foundational data work this kind of analysis depends on, and our guide to enterprise AI data infrastructure covers what needs to be true about your underlying systems before this analysis becomes reliable.
How to build a customer and route profitability framework
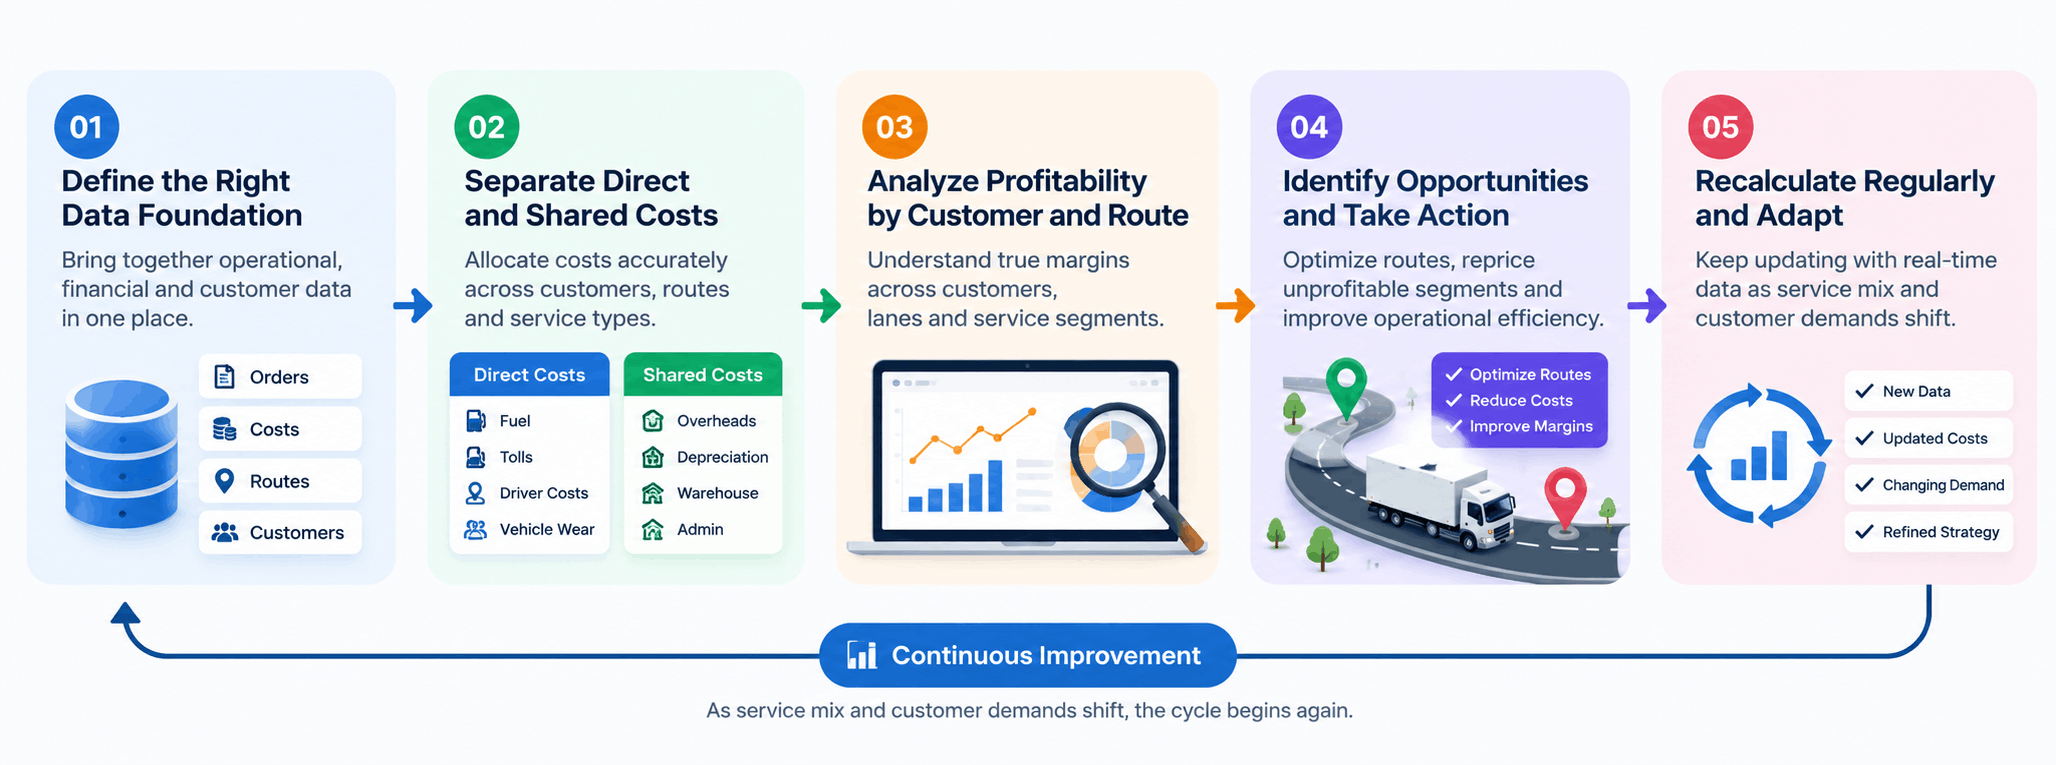
How do logistics companies measure customer profitability? The reliable approach follows a consistent sequence, whether the unit of analysis is a customer, a route, or both.
Separate direct costs from shared costs for every shipment. Direct costs, fuel, driver time, and vehicle costs tied to a specific shipment, are straightforward. Shared costs, warehouse overhead, customer service, and network coordination, need deliberate allocation.
Choose an allocation basis grounded in actual activity, not volume alone. Order management, transportation, and warehousing activities should be costed by the resources they actually consume per customer or route, not spread evenly by shipment count or revenue.
Establish capacity cost rates for shared resources. Determine the cost per hour or per unit of capacity for warehouse labor, customer service time, and shared transportation assets, the foundation time driven activity based costing relies on.
Map every route's true cost, including empty legs and delays. A route's profitability depends on the full round trip cost structure, not just the loaded leg's revenue against fuel cost alone.
Recalculate as service mix and customer demands shift. A customer or route's true cost profile changes as delivery frequency, service level requirements, and volume evolve, meaning a static analysis calculated once quickly goes stale.
This is where the engineering execution layer matters. Samta.ai builds the VEDA AI decision analytics platform to connect TMS, WMS, and ERP data directly into a resource consumption based costing model, integrating with existing Databricks, Snowflake, or Microsoft data infrastructure through our data integration consulting services so 3PL companies are not left stitching together separate exports from each system manually. Institutions evaluating whether a general analytics platform can hold this structure should see how VEDA compares to other data intelligence platforms, and the VEDA platform recalculates customer and route profitability continuously as new shipment and cost data arrives, rather than as a periodic manual exercise.
Costing approaches compared for logistics profitability analysis
Costing Approach | Cost Allocation Basis | Best For | Data Sources Needed | Key Limitation |
Traditional volume based costing | Costs spread by shipment volume or revenue share | A quick, low effort starting view | Aggregate volume and revenue data | Frequently misranks customers and channels, a distortion repeatedly documented in published case studies |
Cost to serve analysis | Aggregate cost drivers blended across the supply chain | Organizations wanting a faster view than full activity based costing | Cost driver data across key supply chain stages | Less granular than activity based costing, can miss customer specific detail |
Activity based costing | Costs assigned to specific customer orders, channels, or routes | Organizations needing precise customer and route level detail | Detailed activity logs across transportation, warehousing, and order management | Resource intensive to build and maintain across many activities |
Time driven activity based costing | Costs allocated using time estimates and capacity cost rates | 3PL companies with variable service mixes across customers | Two inputs, capacity cost rate and activity time estimates | Requires reliable time estimates per logistics activity |
AI driven continuous profitability analytics | Costs allocated continuously from live TMS, WMS, and ERP data | 3PL companies needing ongoing, not periodic, visibility | Integrated data across TMS, WMS, and ERP systems | Requires upfront data integration investment |
Assess Your AI Model Risk with Confidence
Real world enterprise use cases
Regulated industry: a cold chain logistics provider serving pharmaceutical clients
A cold chain 3PL provider serving pharmaceutical and healthcare clients discovered, once activity based costing replaced its volume based model, that its most stringent temperature controlled contracts, previously assumed to be its most profitable given premium pricing, actually carried the thinnest margins once specialized handling, compliance documentation, and equipment costs were properly allocated. Reviewing why enterprise AI data infrastructure matters helped the provider build the data foundation needed to sustain this more accurate view going forward.
General enterprise: a regional 3PL identifying unprofitable routes
A regional 3PL company running customer and route profitability analysis for the first time found several high volume routes were quietly unprofitable once empty return legs and driver overtime were fully allocated, despite appearing strong on a simple revenue per mile basis. Supported by digital transformation managed services, the company restructured its route network around the corrected profitability picture rather than the volume based one it had relied on for years.
Key risks and failure modes
Allocating shared costs by revenue or shipment count alone. This is the single most common distortion documented across published activity based costing case studies in transportation and logistics.
Ignoring empty return legs and delays in route profitability. A route's true cost includes the full round trip, and ignoring empty legs consistently overstates a route's actual margin.
Treating a one time analysis as permanent. Customer service requirements, delivery frequency, and route network structure shift over time, and a profitability analysis calculated once becomes progressively less accurate.
Underestimating indirect cost proportion. As customer service and network coordination costs grow relative to direct transportation cost, ignoring or underweighting them increasingly distorts the resulting picture.
Building a costing model too complex to maintain manually. Full activity based costing's data burden is well documented as a common reason implementations stall, which is part of why time driven variants and AI driven continuous models were developed specifically to reduce that burden.
When to invest in a more rigorous profitability methodology
Invest in a more rigorous methodology when:
Indirect costs represent a significant share of your total cost structure
Customer or route level decisions, pricing changes, network restructuring, are being made based on current profitability reports
Your customer or route portfolio is large enough that a small allocation error compounds into a meaningful strategic misjudgment
A simpler approach may still be enough when:
Your operation is small enough that direct costs dominate and shared cost allocation has limited impact
No major pricing, network, or customer relationship decisions are imminent
Your current volume based view has been validated against a more detailed analysis recently and held up well
Reviewing Samta.ai's case studies alongside your own customer and route portfolio, and our broader work in enterprise AI engineering in Singapore and the wider APAC logistics sector, gives a useful benchmark for how much a more accurate model might change your current rankings.
Talk to an AI Expert About Your Business Needs
Conclusion
Customer profitability analytics built on volume or revenue share produces a ranking that reflects the allocation method more than actual performance. Logistics and 3PL companies that move to activity based or continuously updated AI driven costing make pricing, network, and customer decisions based on what each customer and route genuinely costs to serve, not a costing artifact.
About Samta
Samta.ai is a Singapore-headquartered AI Product Engineering & Data Intelligence partner helping enterprises build production-grade AI systems for regulated and data-intensive environments.We help organizations move beyond experimentation by engineering scalable, explainable, and enterprise-ready AI solutions from data foundations and model development to workflow automation and deployment.
Our capabilities combine deep AI expertise, data engineering, and product engineering to deliver measurable business impact across FinTech, BFSI, cybersecurity, regulatory technology, and enterprise operations.
Our enterprise AI products power real-world intelligence systems:
• TATVA : AI-driven data intelligence platform for governed analytics, monitoring, and operational insights
• VEDA : Explainable and audit-ready AI decisioning engine built for compliance-sensitive enterprise workflows
• CORA-Property Management Solutions: : Predictive intelligence platform for real-estate pricing, portfolio optimization, and investment analytics
Backed by ecosystem partnerships with Microsoft, Databricks, Snowflake, and AWS, Samta.ai delivers agile, cost-efficient AI engineering with faster turnaround and enterprise-grade scalability. Trusted by enterprises across FinTech, BFSI, and digital transformation initiatives, Samta.ai embeds AI governance, data privacy, and compliance-by-design principles directly into the AI lifecycle , enabling organizations to scale AI with transparency, accountability, and operational control.
Enterprises leveraging Samta.ai automate 65%+ of repetitive data, analytics, and decision workflows while maintaining governance, explainability, and measurable business outcomes. Samta.ai provides the strategic consulting, AI engineering, and data modernization expertise needed to align enterprise operations with next-generation AI transformation goals.
Frequently asked questions
How do logistics companies measure customer profitability?
Logistics companies measure customer profitability by allocating both direct costs, such as fuel and driver time, and shared costs, such as warehouse overhead and customer service, to each specific customer based on actual activity consumption rather than aggregate volume or revenue share.
What is route profitability analysis?
Route profitability analysis calculates whether a specific route or lane generates margin once the full cost structure, including fuel, labor, vehicle costs, and empty return legs, is properly allocated, rather than judging a route by volume or loaded leg revenue alone.
How can 3PL companies identify unprofitable clients or routes?
3PL companies identify unprofitable clients or routes by replacing volume based cost allocation with activity based or time driven activity based costing, which assigns shared costs according to actual resource consumption rather than a flat ratio that can misrepresent true profitability.
What data is needed for logistics customer profitability analysis?
Reliable analysis needs data from transportation management systems, warehouse management systems, and enterprise resource planning systems, covering shipment volumes, route details, labor time, and shared overhead costs across every customer and route in the network.
What analytics platforms help a logistics company analyze customer profitability across ERP and operational data?
Platforms that integrate directly with TMS, WMS, and ERP systems and apply activity based or time driven costing logic to that combined data are best suited, since customer profitability analysis depends on connecting cost and operational data that typically sits in separate systems.