
Summarize this post with AI
Most 3PLs know their total revenue. Few know which route, customer or warehouse actually makes money. A logistics analytics platform solves that by joining cost, customer, route and operational data into one connected view, instead of four separate reports that never agree. This guide shows what the platform needs to do, and how to build toward it.
Logistics analytics platform:
A logistics analytics platform integrates transportation management, warehouse management, ERP and CRM data into a single model, so cost, revenue and service metrics can be traced to a specific route, customer or shipment. Gartner reports that by 2028, a quarter of logistics KPI reporting will run on generative AI, which only works when the underlying data is already unified. For APAC operators, this connects directly to national logistics digitalisation programmes such as Singapore's Logistics Industry Transformation Map.
What is a logistics analytics platform?
A logistics analytics platform is a system that combines data from transportation management systems (TMS), warehouse management systems (WMS), ERP, CRM and telematics into one connected model for reporting and decision making. This differs from logistics BI, which is usually a dashboard layer sitting on top of a single source. A full platform also handles integration, data quality and lineage underneath the dashboards. Related terms buyers search for include logistics analytics software (the tool category), transportation analytics software (the routing and fleet slice), and supply chain analytics (the wider category covering planning, procurement and logistics together).
Four data domains typically feed the platform:
Cost data: fuel, labour, fleet, warehousing, last mile
Customer data: contracts, service level agreements, volume commitments
Route and network data: lanes, transit time, load factor
Operational data: dock times, pick rates, exceptions, returns
Identify Gaps, Risks, and Opportunities in Your AI Journey
Why this matters now
Three forces are pushing logistics leaders to unify this data in 2026.
AI adoption is arriving fast. Gartner predicts 25 percent of logistics KPI reporting will run on GenAI by 2028, based on a survey where half of supply chain leaders planned GenAI adoption within a year. GenAI on top of disconnected systems just automates confusion faster.
Analytics investment is not converting to results. Gartner also found that eight in ten supply chain leaders investing in analytics are not realising the expected benefits, which points to weak data foundations, not weak tools.
Regional digitalisation is a policy priority. Singapore has set a target for 40 percent of logistics SMEs to adopt at least one digital solution by 2025 under the refreshed Logistics Industry Transformation Map, with named cases showing warehouse automation lifting picking accuracy to 99.9 percent. Analytics is the next layer once that automation data exists. Read a related deep dive on how modern enterprises build this kind of connected data foundation.
A four step framework for connecting cost, customer, route and operations
Here is the sequence that gets a logistics business from siloed reports to one connected model.
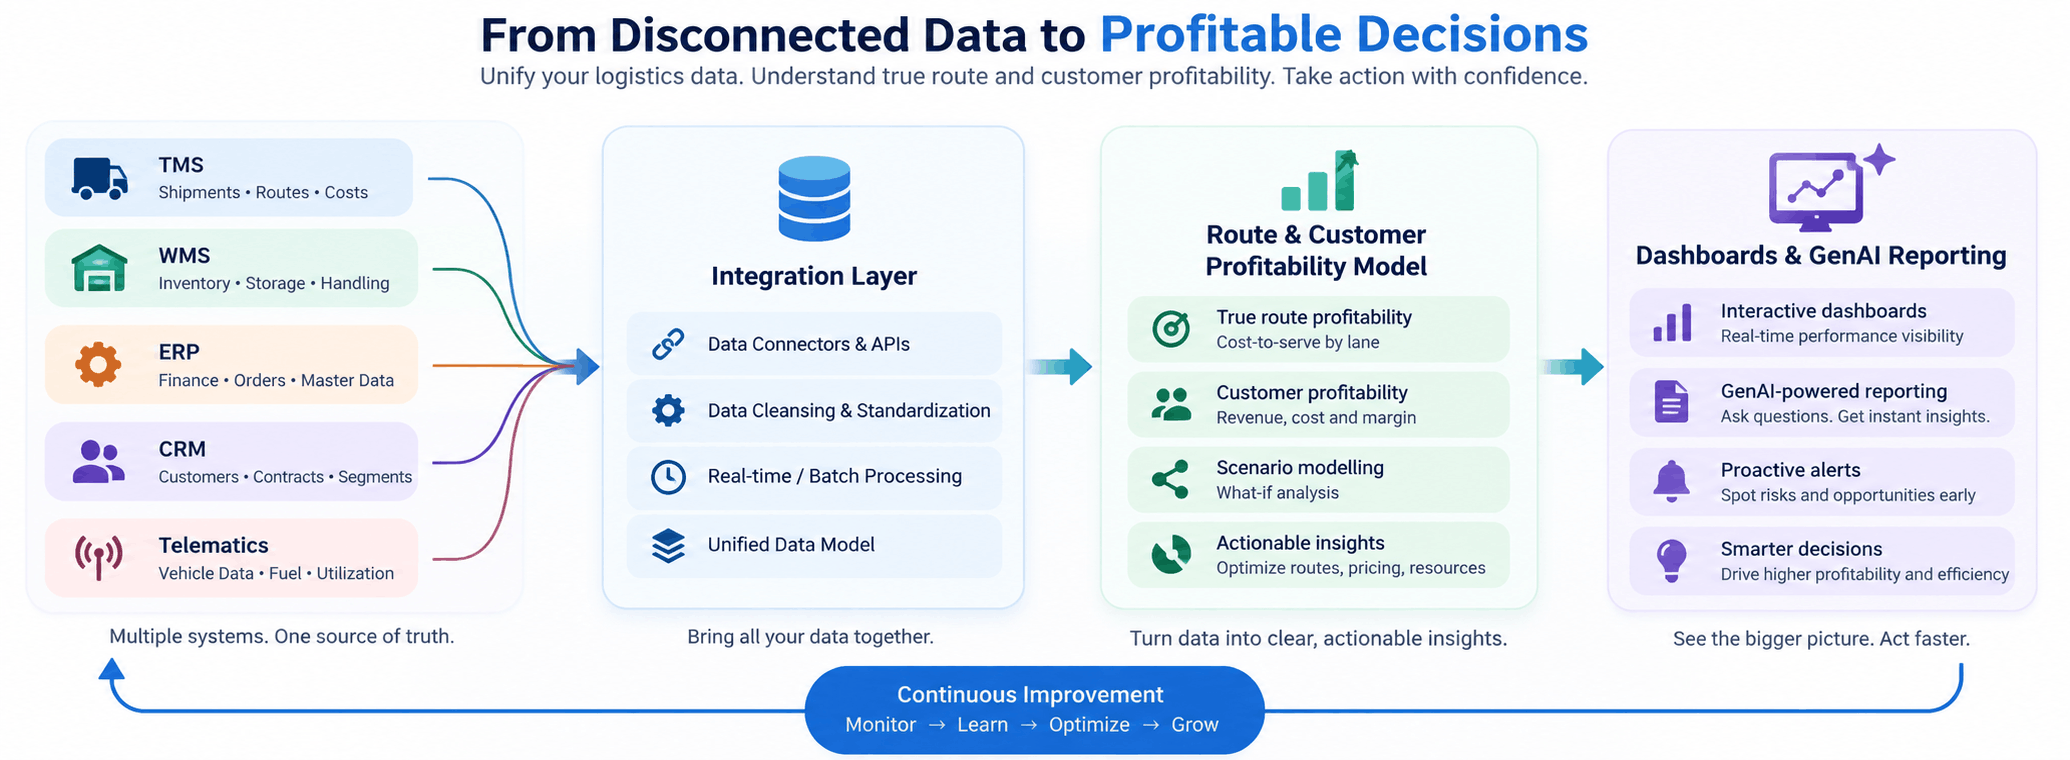
Inventory your systems and their grain. List every TMS, WMS, ERP, CRM and telematics source. Note what level each one reports at: shipment, order, route or day. Mismatched grain is the most common blocker to joining data later.
Define the shared keys. Agree one identifier each for shipment, customer, route and cost centre across all systems. Without this, "customer 4521" in the TMS and "account 88" in the CRM never join cleanly.
Build the integration layer. Move data from source systems into a warehouse or lakehouse on Snowflake, Databricks or Microsoft Fabric using scheduled or event based pipelines. Enterprise data integration engineering covers the pipeline patterns for this kind of multi source join. Specialist data integration consulting services can shorten this build for teams without in house data engineers.
Model profitability at the route and customer level. Combine cost allocation, revenue and volume into a single semantic layer, so a lane, customer or warehouse can be scored on true margin, not just revenue. Samta.ai's Veda platform and the underlying Veda AI decision analytics product serve this layer, acting as the engineering execution point once the raw data is integrated. This is also where AI powered insights get generated on top of clean, connected data.
Comparing five ways to analyse logistics data
Approach | Data sources covered | Route level profitability | Customer level profitability | Best fit |
TMS native reports | Routes and shipments only | Partial, cost only | No | Fleet and dispatch teams |
WMS native reports | Warehouse operations only | No | No | Warehouse managers |
Spreadsheet consolidation | Manual pull from multiple systems | Slow, error prone | Slow, error prone | Small operators, ad hoc analysis |
Point BI tool on one source | One system, dashboarded | Single source view only | Single source view only | Departmental reporting |
Unified logistics analytics platform | TMS, WMS, ERP, CRM, telematics | Yes, true margin | Yes, true margin | Multi site 3PLs and enterprise shippers |
Only the unified platform in the last row connects cost, customer, route and operations in one place. For a detailed product level comparison, see Veda versus a general Data Intelligence Platform.
Turn AI Model Risk Into Actionable Insights
Real world use cases
Regulated freight and customs brokerage
A customs brokerage handling regulated cargo tracks compliance timestamps in one system and cost data in another. Auditors ask for a full trail from shipment to invoice, and staff currently rebuild this by hand across three exports.
A connected model links shipment, customs event and cost records on a shared shipment ID. Compliance reporting becomes traceable instead of reconstructed, and analysts stop losing days per audit cycle. See how this looks in practice in Samta.ai's case studies.
General 3PL: route and customer profitability
A 3PL runs 40 lanes for 60 customers. Finance reports total margin monthly. Nobody can say which of the 40 lanes are actually profitable, because fuel, labour and warehousing costs are allocated at the company level, not the lane level.
Once cost, route and customer data are joined, the same margin figure splits into lane level and customer level views. Two lanes turn out to run at a loss, and one customer accounts for most of the exception handling cost. Both become renegotiation or pricing conversations instead of guesses.
Key risks and failure modes
False margin confidence. Company wide margin looks healthy while specific lanes or customers quietly lose money.
Cost allocation shortcuts. Spreading fuel or labour evenly across all shipments hides which operations actually drive cost.
Siloed exception data. Delays and returns get logged in the WMS or TMS but never reach the profitability model, so root causes stay invisible.
Stale customer contracts. Rate cards change in the CRM but never sync to the cost model, so margin calculations use outdated pricing.
Dashboard sprawl without a shared model. Multiple BI tools, each on a single source, produce different numbers for the same lane, and nobody trusts any of them.
AI on ungoverned data. Feeding GenAI reporting tools disconnected source data just produces confident, wrong summaries faster.
When to build a unified logistics analytics platform, and when not to
Build now if:
You operate more than one system among TMS, WMS, ERP and CRM
Finance and operations report different margin numbers for the same lane or customer
You cannot currently rank customers or routes by true profitability
You are piloting GenAI reporting and need a trustworthy data layer underneath it
Hold off if:
You run a single integrated system that already covers cost, route and customer data
Your shipment volume is too low for route level analysis to matter yet
You have not assigned an owner for data definitions across departments
Read more on AI ROI measurement to build the business case before committing budget, and AI mode analysis for how AI features layer onto this kind of platform once it exists.
Let’s Find the Right AI Approach for Your Business
Conclusion
Company wide margin numbers can look fine while specific routes and customers quietly bleed money. A connected view across cost, route, customer and operations is the only way to find them before they compound. Build the connection once, and every report downstream, including AI generated ones, gets more reliable. The next step is seeing it work on your own data.
About Samta
Samta.ai is a Singapore-headquartered AI Product Engineering & Data Intelligence partner helping enterprises build production-grade AI systems for regulated and data-intensive environments.We help organizations move beyond experimentation by engineering scalable, explainable, and enterprise-ready AI solutions from data foundations and model development to workflow automation and deployment.
Our capabilities combine deep AI expertise, data engineering, and product engineering to deliver measurable business impact across FinTech, BFSI, cybersecurity, regulatory technology, and enterprise operations.
Our enterprise AI products power real-world intelligence systems:
• TATVA : AI-driven data intelligence platform for governed analytics, monitoring, and operational insights
• VEDA : Explainable and audit-ready AI decisioning engine built for compliance-sensitive enterprise workflows
• CORA-Property Management Solutions: : Predictive intelligence platform for real-estate pricing, portfolio optimization, and investment analytics
Backed by ecosystem partnerships with Microsoft, Databricks, Snowflake, and AWS, Samta.ai delivers agile, cost-efficient AI engineering with faster turnaround and enterprise-grade scalability. Trusted by enterprises across FinTech, BFSI, and digital transformation initiatives, Samta.ai embeds AI governance, data privacy, and compliance-by-design principles directly into the AI lifecycle , enabling organizations to scale AI with transparency, accountability, and operational control.
Enterprises leveraging Samta.ai automate 65%+ of repetitive data, analytics, and decision workflows while maintaining governance, explainability, and measurable business outcomes. Samta.ai provides the strategic consulting, AI engineering, and data modernization expertise needed to align enterprise operations with next-generation AI transformation goals.
Frequently asked questions
What is a logistics analytics platform?
It is a system that integrates transportation, warehouse, ERP and CRM data into one model, so cost, revenue and service metrics can be analysed at the shipment, route or customer level. Unlike a single dashboard tool, it includes the integration and data quality layer underneath the reports, which is what makes cross system metrics trustworthy rather than guessed.
What should logistics companies measure?
At minimum, track route level margin, customer level margin, on time performance, cost per shipment and exception rate. These metrics only mean something when cost, revenue and operational data are joined on shared shipment, route and customer identifiers. Measuring volume or revenue alone hides where profit is actually being lost.
How can logistics analytics improve profitability?
By revealing which routes, customers or warehouses are unprofitable once true, not averaged, costs are allocated. Many 3PLs discover specific lanes or accounts losing money once cost is properly attributed. That visibility supports pricing changes, lane consolidation or renegotiation instead of company wide cost cutting that damages good accounts along with bad ones.
What analytics platform can connect logistics operations and profitability data?
A platform that ingests TMS, WMS, ERP and CRM data into a shared model, then applies a route and customer level cost allocation on top. Cloud platforms such as Databricks, Snowflake or Microsoft Fabric provide the storage and processing layer, while a decision analytics layer such as Veda turns that connected data into route and customer profitability views.
How can a 3PL analyze route, customer and warehouse profitability?
Start by defining shared keys for shipment, route, customer and cost centre across every system. Integrate the sources into one model, then allocate cost at the actual activity level rather than spreading it evenly. Once margin can be traced to a specific lane, account or warehouse, the 3PL can see which combinations are profitable and which are not.