
Summarize this post with AI
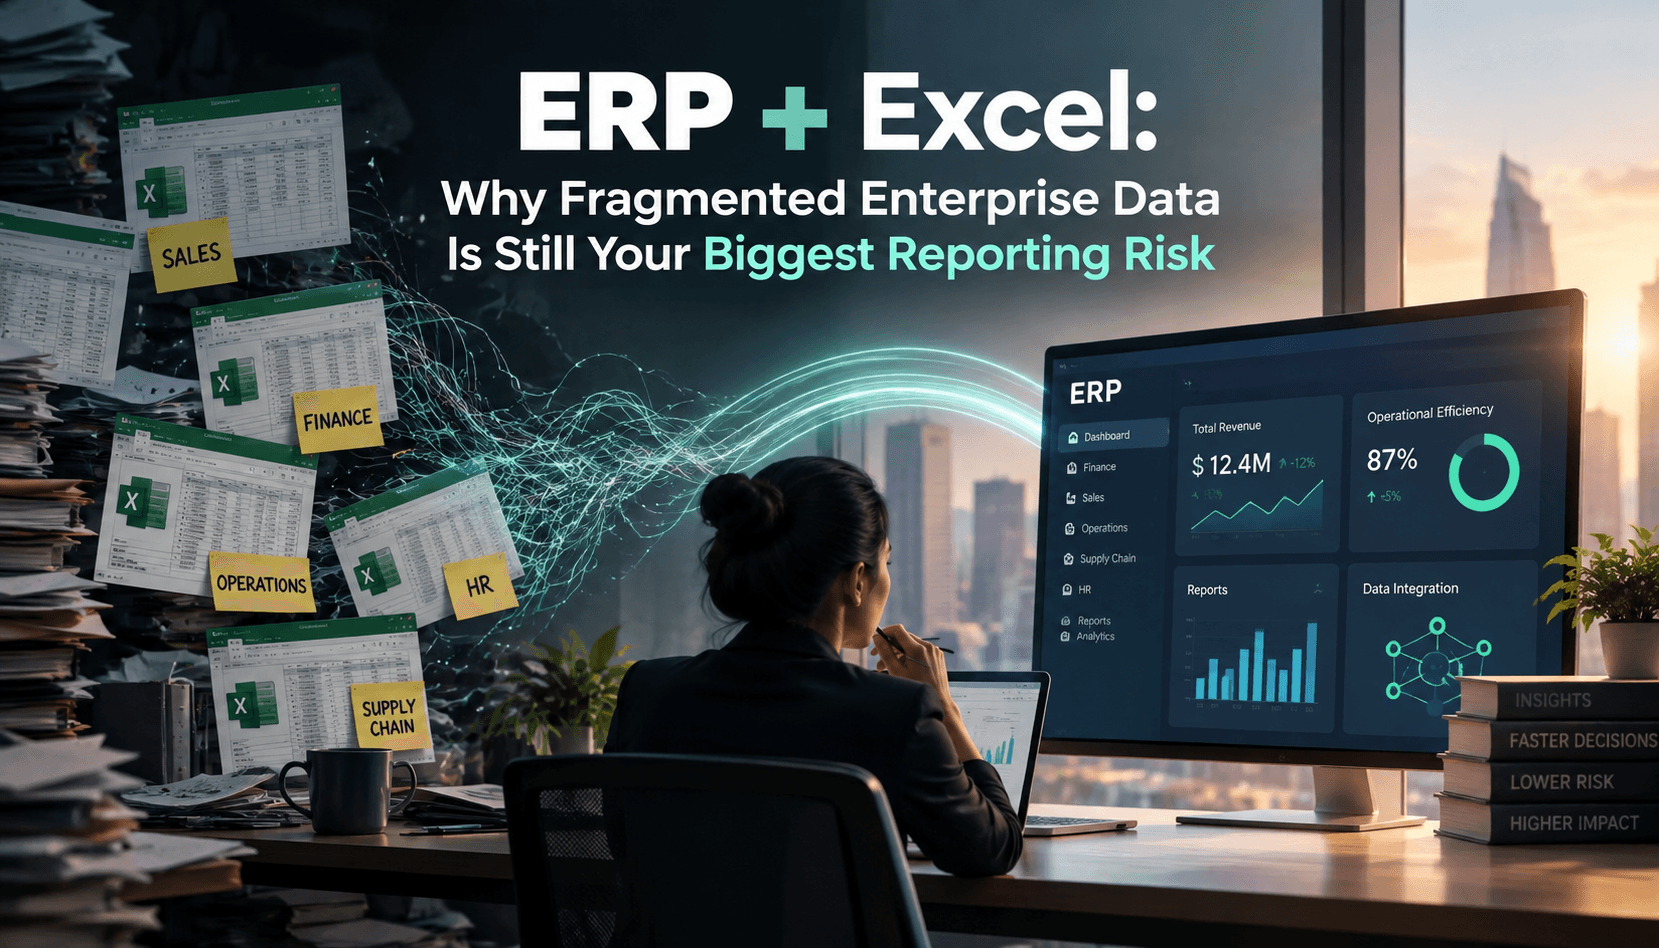
Your ERP is not the source of your board numbers. Excel is. Every month, finance teams export ledgers, paste CRM extracts into workbooks and reconcile the gaps by hand. That is fragmented enterprise data in action, and it is the quietest reporting risk in most large organisations. The answer is direct. Reports fail when systems disagree and spreadsheets act as the referee. The fix is to integrate ERP, CRM and operational sources into one governed layer, so every number has a lineage, an owner and a single definition. This guide shows how.
Fragmented enterprise data:
This condition exists when business data sits in ERP, CRM, operational systems and spreadsheets without shared definitions, lineage or ownership. It is a reporting risk because manual reconciliation creates errors, delays and audit gaps. The fix is a unified enterprise data platform with governed integration, designed to meet standards such as BCBS 239 and the MAS Technology Risk Management Guidelines for regulated APAC institutions.
What is fragmented enterprise data?
Fragmented enterprise data means the same business entity, such as a customer, invoice or product, exists in several systems with different values. SAP, Oracle, Microsoft Dynamics, Salesforce and departmental workbooks each hold a partial version. This is the practical face of data silos. A silo is a store that one team controls and other systems cannot query reliably. Teams often ask what is data silos in database terms. It is a database, schema or file with no shared keys, definitions or access path to the rest of the estate.
CRM and ERP data silos are the classic case. Sales sees a customer as an account. Finance sees a debtor with credit terms. Neither view reconciles on its own.
Fragmentation hides in four places:
ERP ledgers, subledgers and custom reports
CRM pipelines and account hierarchies
Operational systems such as core banking, warehouse and manufacturing platforms
Excel workbooks, email attachments and shadow BI dashboards
The opposite state is unified enterprise data: one governed model where every metric resolves to the same definition. Teams call this a single source of truth, and it is the target of every step below.
Get a Clear View of Your AI Readiness
Why fragmented data matters in 2026
Four pressures make this urgent.
Regulation. The Basel Committee's BCBS 239 principles expect banks to aggregate risk data accurately, completely and on time. Its 2022 progress review found only two of 31 assessed banks fully compliant. In Singapore, the MAS Technology Risk Management Guidelines add expectations for data integrity and governance.
Cost. Gartner puts the average annual cost of poor data quality at $12.9 million per organisation. Conflicting records across systems are a direct contributor.
AI readiness. Models trained on conflicting records inherit the conflict. Building an AI ready data foundation starts with reconciled, governed inputs, not more tooling.
APAC complexity. Regional groups often run several ERP instances across currencies, entities and data residency rules. Teams working on enterprise AI engineering in Singapore meet this pattern often, because every acquisition adds another system.
A five step framework to unify fragmented data
Unification is an engineering programme, not a tool purchase. Here is how enterprise data integration works in practice.
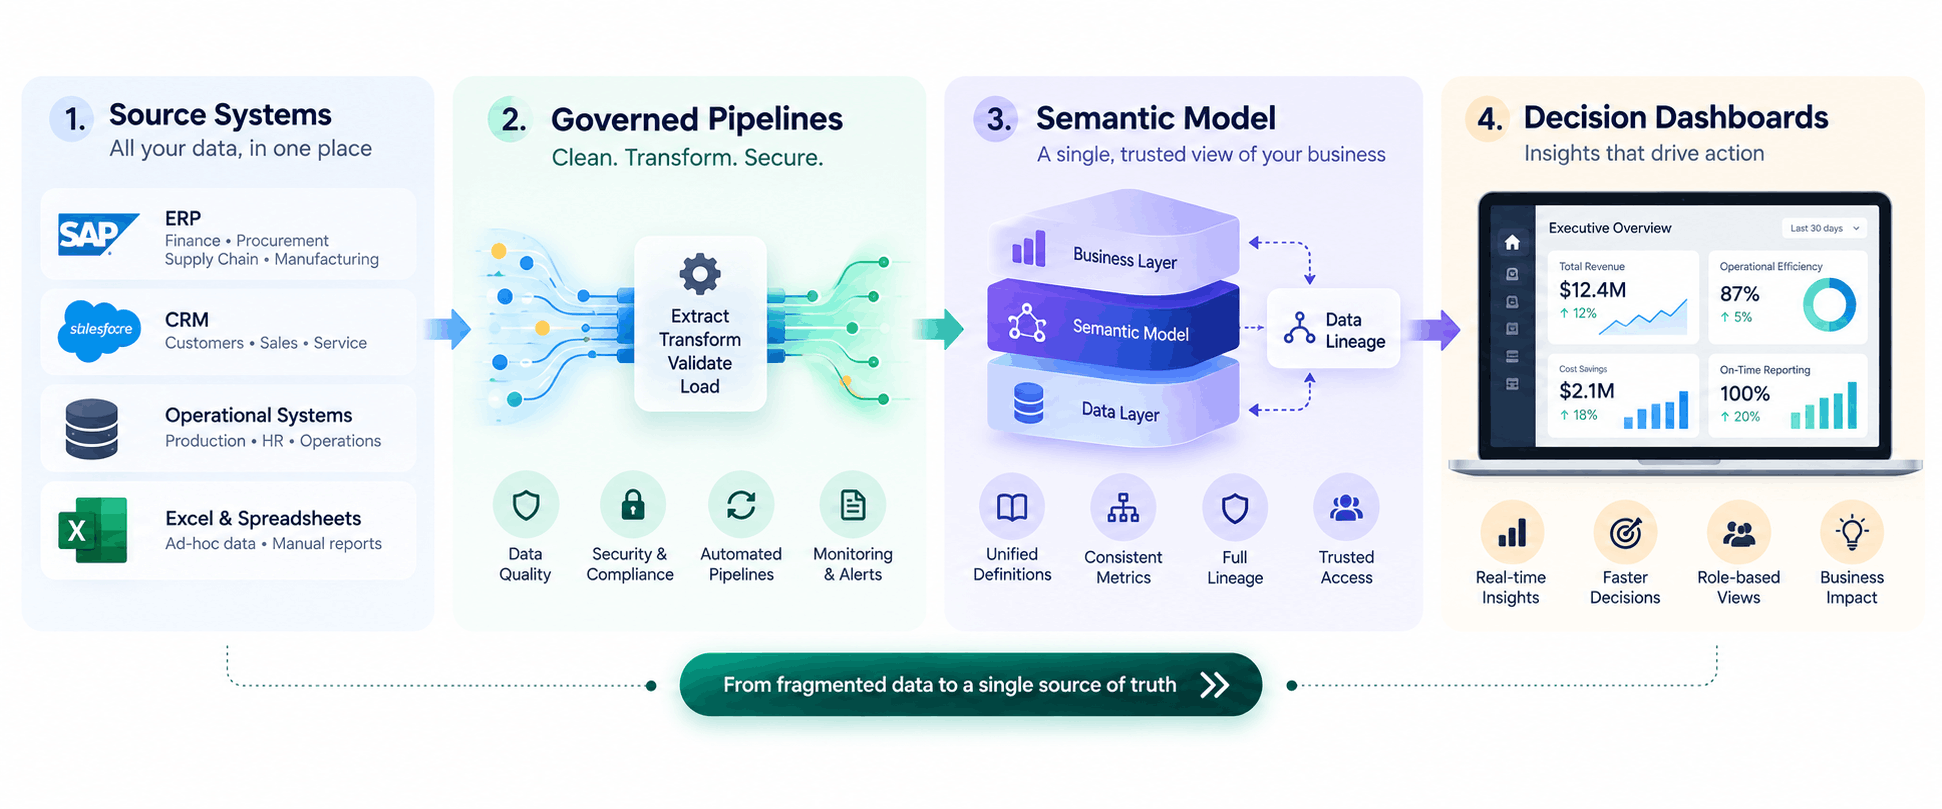
Rank reports by risk. List board, regulatory and finance reports. Score each on manual effort, audit exposure and source count. Start with the top three.
Define shared entities. Agree one definition each for customer, legal entity, product, GL account and revenue. Record them as data contracts with named owners. Specialist data integration consulting services shorten this alignment work.
Build governed pipelines. Move ERP, CRM and operational data through change data capture or scheduled ELT into a lakehouse or warehouse on Databricks, Snowflake or Microsoft Fabric. Enterprise data integration engineering covers pipeline design, orchestration and testing.
Model, govern and trace. Add a semantic layer, quality rules and lineage from source to report. This step delivers the traceability that BCBS 239 style reviews look for.
Deliver decisions, not extracts. Replace workbook consolidation with governed dashboards. Samta.ai's Veda platform serves this layer, and the Veda AI decision analytics product page details its modules. The result is cross system analytics without manual work.
Samta.ai acts as the engineering execution layer for steps 3 and 4 through its enterprise data integration services. It builds on the Databricks, Snowflake or Microsoft stack a client already runs, so no platform swap is forced.
Comparing five approaches to enterprise reporting
Approach | Data freshness | Governance and audit trail | Manual effort | Best fit |
Excel exports and manual consolidation | Stale after each export | Weak, no lineage | Very high | Ad hoc analysis only |
ERP native reporting | Near real time inside one system | Strong inside ERP, blind to other systems | Medium | Single system operational reports |
Point to point integrations and ETL scripts | Scheduled, often nightly | Fragmented and script dependent | Medium to high | Small estates with few sources |
Cloud warehouse or lakehouse (Snowflake, Databricks, Microsoft Fabric) | Hourly to near real time | Strong, with lineage and access controls | Low after build | Multi source enterprise reporting |
Unified enterprise data platform with decision analytics (for example Veda) | Near real time | Strong, policy driven, auditable | Lowest | Regulated and AI ready enterprises |
Only the last two rows remove manual consolidation. A unified enterprise data platform in the final row combines governed storage with decision analytics. For a vendor level view, read the Veda vs Data Intelligence Platform comparison.
Assess Your AI Model Risk with Confidence
Real world enterprise use cases
BFSI: consolidated risk and finance reporting (illustrative scenario)
A regulated bank pulls exposure from core banking, ledger balances from ERP and relationship data from CRM. Each month, analysts stitch these into workbooks for risk and finance packs. Definitions differ, so reconciliation takes days. After unification, all three sources feed one governed model with lineage. Risk and finance reports draw from the same tables. Reviewers can trace a figure to its source system, which supports BCBS 239 style aggregation and supervisory audit expectations. Samta.ai publishes examples of this kind of work in its case studies.
General enterprise: revenue and forecast alignment
A manufacturer runs SAP for billing, Salesforce for pipeline and Excel for forecasting. Sales reports bookings, finance reports invoiced revenue, and the forecast workbook blends both by hand. Leadership meets to debate whose number is right.
A unified layer maps opportunity to order to invoice on shared keys. The debate moves from "which number" to "what action".
Key risks and failure modes
These ERP and Excel reporting problems compound each other:
Version drift. Two copies of one workbook circulate, and both look correct until the numbers reach the board.
Hidden formula errors. Manual links and pasted values break silently. No test suite protects a spreadsheet.
Audit gaps. Excel gives no lineage from a reported figure to its source transaction. Auditors ask for exactly that.
Key person dependency. One analyst knows which tab to refresh. Their leave becomes a reporting incident.
Shadow definitions. Each team defines "active customer" differently, so dashboards disagree.
Bad inputs for AI. Forecasting models and copilots amplify whatever inconsistency they are fed.
Programmes fail too. Unifying data without domain owners recreates silos within a year, so name an owner per domain before building.
When to unify and when to wait
Unify now if:
Month end close depends on manual consolidation across three or more systems
Regulators or auditors ask for lineage you cannot produce
Finance, sales and operations dispute the same metric
AI or forecasting projects are stalled on inconsistent inputs
Start small or wait if:
One ERP already serves nearly all reporting needs
No executive owns data definitions
Core systems are mid migration and will change soon
The reports in question are one off and low risk
Model the return before committing. This breakdown of data engineering ROI shows how to value saved analyst hours, faster close and avoided rework.
Let’s Find the Right AI Approach for Your Business
Conclusion
Fragmented data does not announce itself. It appears as a late close, a disputed forecast or an audit finding you cannot trace. ERP and Excel will keep producing those symptoms until a governed layer sits between your systems and your reports. Start with the three riskiest reports, assign owners and build outward. The next step is a briefing, not a big programme.
About Samta
Samta.ai is a Singapore-headquartered AI Product Engineering & Data Intelligence partner helping enterprises build production-grade AI systems for regulated and data-intensive environments.We help organizations move beyond experimentation by engineering scalable, explainable, and enterprise-ready AI solutions from data foundations and model development to workflow automation and deployment.
Our capabilities combine deep AI expertise, data engineering, and product engineering to deliver measurable business impact across FinTech, BFSI, cybersecurity, regulatory technology, and enterprise operations.
Our enterprise AI products power real-world intelligence systems:
• TATVA : AI-driven data intelligence platform for governed analytics, monitoring, and operational insights
• VEDA : Explainable and audit-ready AI decisioning engine built for compliance-sensitive enterprise workflows
• CORA-Property Management Solutions: : Predictive intelligence platform for real-estate pricing, portfolio optimization, and investment analytics
Backed by ecosystem partnerships with Microsoft, Databricks, Snowflake, and AWS, Samta.ai delivers agile, cost-efficient AI engineering with faster turnaround and enterprise-grade scalability. Trusted by enterprises across FinTech, BFSI, and digital transformation initiatives, Samta.ai embeds AI governance, data privacy, and compliance-by-design principles directly into the AI lifecycle , enabling organizations to scale AI with transparency, accountability, and operational control.
Enterprises leveraging Samta.ai automate 65%+ of repetitive data, analytics, and decision workflows while maintaining governance, explainability, and measurable business outcomes. Samta.ai provides the strategic consulting, AI engineering, and data modernization expertise needed to align enterprise operations with next-generation AI transformation goals.
Frequently asked questions
Why is fragmented enterprise data a reporting risk?
Because reports built from disconnected systems cannot be trusted or traced. Each manual export, paste and reconciliation adds a chance of error, and each spreadsheet hides its logic. Leaders then act on numbers that differ between departments. In regulated sectors, missing lineage also creates audit findings under frameworks such as BCBS 239, so the risk is operational and regulatory at once.
What are the risks of relying on ERP and Excel for management reporting?
The main risks are stale data, version conflicts, hidden formula errors and no audit trail. ERP reports cover only one system, so teams export to Excel to combine sources. That step breaks lineage and depends on individuals. Management then sees late, inconsistent figures. Over time, the workbook becomes an unofficial system of record that nobody governs or tests.
How can companies unify data across ERP, CRM, and operational systems?
Start by ranking reports by risk, then define shared entities such as customer and legal entity. Integrate sources through governed pipelines into a warehouse or lakehouse, add a semantic layer with lineage and quality rules, and serve reports from that layer. Assign a named owner to each data domain, or the silos return within months.
What tools unify ERP, CRM, and Excel data for business reporting without manual work?
Cloud platforms such as Snowflake, Databricks and Microsoft Fabric store and model combined data, while integration tools such as Fivetran, Azure Data Factory or Airbyte move it. A decision analytics layer, such as Samta.ai's Veda, sits on top to deliver governed reports. Excel can remain as a front end connected to that governed layer rather than a data store.
What are the risks of using spreadsheets alongside ERP systems for financial reporting?
Spreadsheets sit outside ERP controls, so approvals, access rights and change logs do not apply. Manual adjustments can alter reported results without a trace. Formula errors go undetected, and consolidation depends on individual analysts. For financial reporting, auditors may challenge figures they cannot trace to source transactions, which extends the close and raises compliance exposure.