

Summarize this post with AI
A pricing model that looks accurate on its training data can still misprice half your live inventory. The gap between the two is almost always a testing problem, not a modeling one. Real estate price prediction depends less on which algorithm you choose and more on whether you collected the right data and tested accuracy the right way. This guide covers both, with the specific metrics appraisers and valuers actually use to judge whether a model is trustworthy.
Real estate price prediction:
Real estate price prediction models estimate property value using comparable sales, hedonic pricing attributes and geospatial data, most commonly tested for accuracy using mean absolute percentage error, MAPE. RICS, the Royal Institution of Chartered Surveyors, confirms that an automated valuation model output not reviewed by a qualified valuer does not meet professional valuation standards, which is why model accuracy testing matters as much as model building. For developers and investors across India and the wider APAC region, the right data foundation and a disciplined accuracy test matter more than the specific machine learning technique chosen.
What is real estate price prediction?
Real estate price prediction is the use of statistical or machine learning models to estimate a property's market value based on its characteristics, location and comparable transactions. This sits within the broader practice of data science for real estate, which also covers lead scoring, rental yield forecasting and occupancy analytics. Price prediction is the narrowest and most data demanding of these use cases.
A property price prediction model differs from a general ai property valuation tool in scope. A prediction model is the underlying statistical engine. A valuation tool is the packaged product, often including the user interface, comparable selection logic, and reporting layer built around that engine. For a broader breakdown of how this fits into real estate data science overall, see top 10 data science applications and proptech consulting, where data science pays back.
Ready to Scale AI? Start with a Free Assessment
Why this matters now for developers and investors
Three developments make rigorous price prediction testing a priority in 2026.
Professional valuation standards now explicitly address automated models. RICS's Global Red Book 2025 states directly that an AVM output not subject to the application of professional judgement by a valuer is not compliant with RICS valuation standards, meaning automated predictions still need human oversight for formal valuation purposes.
Mass appraisal has a long established accuracy testing standard. IAAO's Standard on Ratio Studies defines the coefficient of dispersion as the primary measure of appraisal uniformity, with values of 15.0 or lower generally associated with good appraisal quality, a benchmark that applies equally well to modern price prediction models.
The underlying economic theory behind feature based pricing is well established. Sherwin Rosen's foundational 1974 paper on hedonic prices and implicit markets, published in the Journal of Political Economy, remains the theoretical foundation most modern hedonic pricing models still build on.
See how predictive models apply across the wider property lifecycle in 7 ways AI predicts real estate outcomes, and the consulting layer that supports this in proptech AI consulting services.
A five step framework: data, features and accuracy testing
Here is the sequence that produces a price prediction model you can actually trust, not just one that looks accurate on paper.
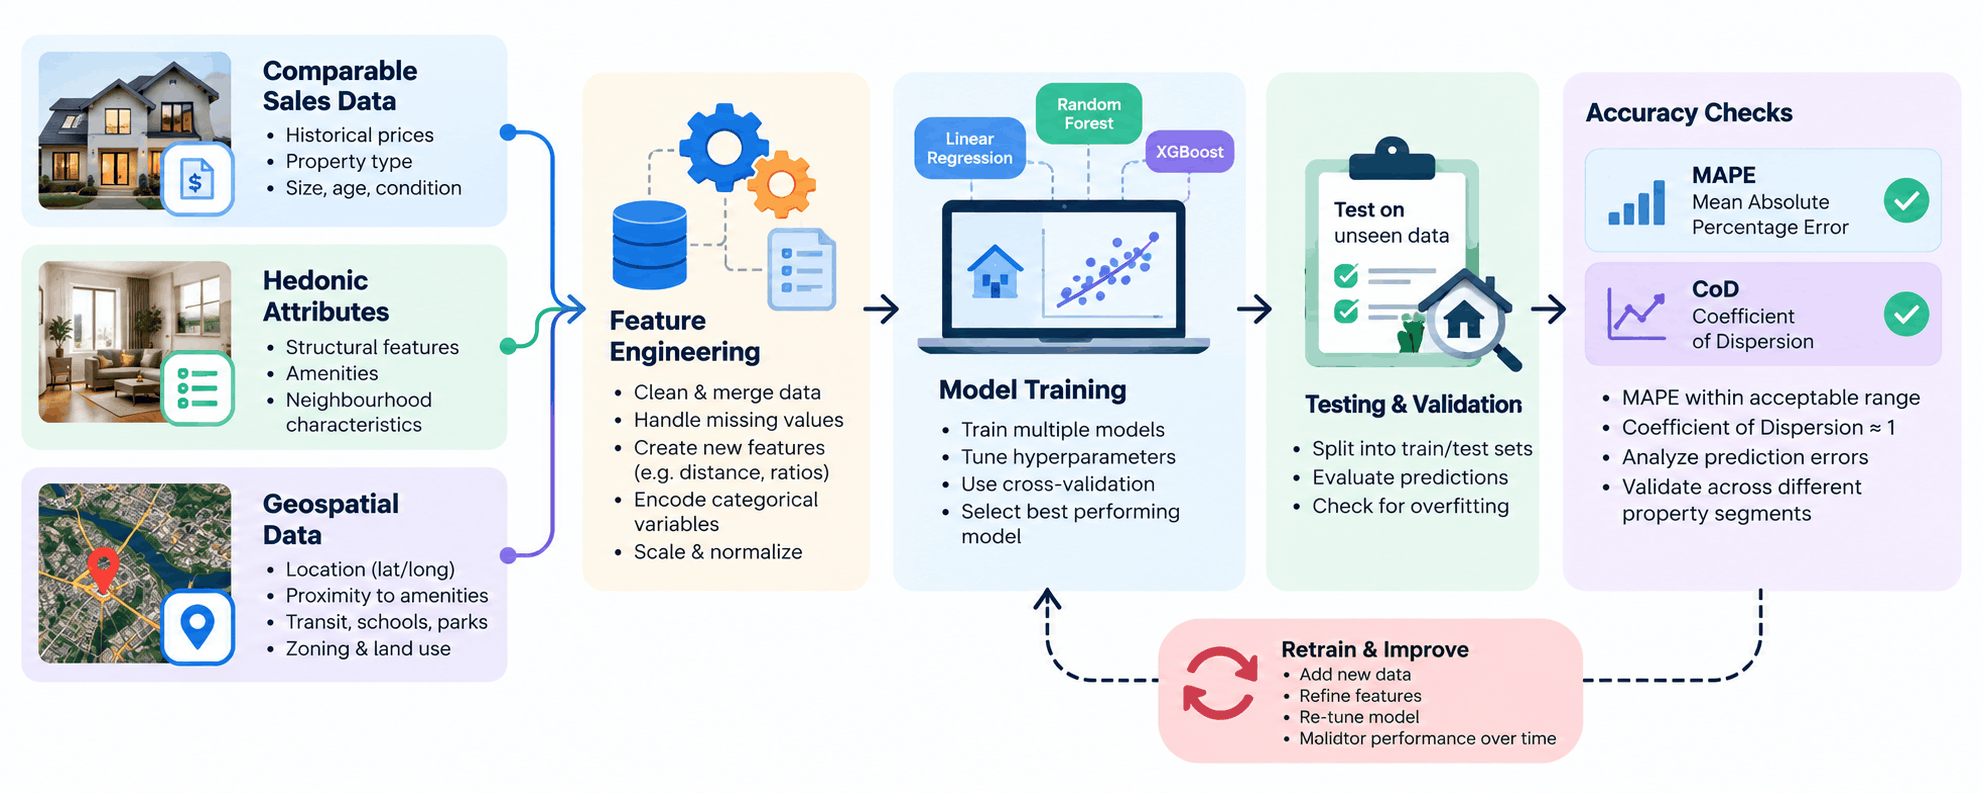
Collect comparable sales data at sufficient volume and recency. Comparable sales need to reflect the specific submarket and property type, not a broad citywide average that hides local pricing differences.
Build hedonic pricing features deliberately. Square footage, bedroom count, floor level, age and amenities each function as implicit prices under Rosen's hedonic framework, and missing a significant attribute biases the model systematically, not randomly.
Add geospatial data as a distinct feature layer. Geospatial data, distance to transit, school zones, flood risk, often explains more price variation than property specific attributes alone, particularly in dense urban markets.
Engineer features before choosing an algorithm. Feature engineering quality consistently matters more than model complexity, a well engineered linear model frequently outperforms a poorly fed complex one. Data integration consulting services support connecting these scattered data sources into one usable training set.
Test accuracy with MAPE and a ratio study style check for bias. MAPE measures average prediction error as a percentage, while a coefficient of dispersion check, drawn from IAAO's mass appraisal standard, tests whether errors are evenly distributed or systematically biased toward over or under valuation. Samta.ai's Cora AI driven property management platform and the Cora product support this ongoing testing directly, acting as the engineering execution layer once the data foundation is in place.
Comparing five approaches to real estate price prediction
Approach | Data needed | Accuracy testing method | Typical MAPE range | Best fit |
Manual comparable sales analysis | A handful of recent comparable transactions | Informal, analyst judgement | Highly variable, analyst dependent | Single property valuation, low volume |
Simple hedonic regression | Structured property attributes, moderate transaction volume | Statistical significance testing, R squared | Moderate, 8 to 15 percent typical | Academic or research grade analysis |
Tree based machine learning model | Large transaction volume, many engineered features | Train and test split, MAPE on held out data | Lower, often 5 to 10 percent with good data | Developers pricing large inventory |
Commercial AVM or property valuation AI tool | Vendor provided comparable and attribute data | Vendor reported accuracy, often undisclosed methodology | Varies widely by vendor and market | Quick estimates, not formal valuation |
Integrated proptech platform with continuous retraining | All of the above, continuously updated | MAPE plus coefficient of dispersion, reviewed on a fixed cycle | Lowest achievable, improves over time | Developers and platforms pricing inventory at scale |
The last row is the only approach that treats accuracy testing as ongoing rather than a one time check. For a platform level comparison, see Cora versus traditional property management software.
Discover Where Your AI Models Are Most Exposed
Real world use cases
Regulated angle: fractional ownership platform pricing commercial assets
A fractional ownership platform needed defensible, consistent pricing across commercial office assets in multiple cities to meet investor disclosure expectations. Manual valuation varied meaningfully between analysts covering different markets. A hedonic pricing model, trained on comparable transaction data and tested using both MAPE and a coefficient of dispersion check, gave the platform a documented, repeatable methodology that held up under investor and auditor scrutiny. See related delivery patterns in Samta.ai's case studies.
General enterprise: developer mispricing new launch inventory
A residential developer priced a new launch using a model trained primarily on resale transaction data, which systematically underpriced new construction premium. The model's overall MAPE looked acceptable, but a coefficient of dispersion check revealed the errors were not evenly distributed, they skewed consistently low for new builds specifically. Adding a new construction premium feature and retraining closed this systematic bias, a gap that a MAPE figure alone had not revealed. This kind of accuracy discipline also connects to broader investment grade analytics covered in AI wealth management platforms.
Key risks and failure modes
Reporting MAPE without checking for systematic bias. A reasonable average error can hide one consistently mispriced segment, new builds, a specific submarket, that a single aggregate number conceals.
Training on too few comparable sales. Thin transaction volume in niche submarkets produces models that look statistically sound but generalise poorly to new properties.
Omitting geospatial features entirely. Location driven price variation is often the single largest factor in real estate value, and skipping it understates model accuracy significantly.
Treating an AVM output as a finished valuation. RICS is explicit that an automated output without professional judgement applied does not meet formal valuation standards.
Never retesting after initial deployment. Market conditions shift, and a model validated a year ago may no longer reflect current pricing dynamics without periodic retesting.
Choosing model complexity over feature quality. A complex model fed poorly engineered features consistently underperforms a simpler model built on well constructed hedonic and geospatial features.
How accurate are AI property price models, and when to trust them
Trust the model's output directly when:
MAPE sits consistently below 10 percent across the relevant submarket
A coefficient of dispersion check confirms errors are evenly distributed, not systematically biased
The training data includes sufficient recent comparable sales for the specific property type
The use case is internal pricing guidance, not a formal valuation requiring professional sign off
Require human review before relying on the output when:
The output will be used for a formal valuation, loan collateral, or regulatory disclosure
Comparable sales volume in the relevant submarket is thin
The property has unusual characteristics the model's training data likely did not cover well
MAPE or coefficient of dispersion checks have not been run recently against current market data
Let’s Discuss Your AI Strategy
Conclusion
A pricing model’s accuracy is only as credible as the test behind it. MAPE alone tells you how far off a model is on average, not whether it is consistently wrong for a specific property type. Collect the right comparable, hedonic and geospatial data, then test for both overall accuracy and systematic bias. The next step is running this test against your own actual transactions.
About Samta
Samta.ai is a Singapore-headquartered AI Product Engineering & Data Intelligence partner helping enterprises build production-grade AI systems for regulated and data-intensive environments.We help organizations move beyond experimentation by engineering scalable, explainable, and enterprise-ready AI solutions from data foundations and model development to workflow automation and deployment.
Our capabilities combine deep AI expertise, data engineering, and product engineering to deliver measurable business impact across FinTech, BFSI, cybersecurity, regulatory technology, and enterprise operations.
Our enterprise AI products power real-world intelligence systems:
• TATVA : AI-driven data intelligence platform for governed analytics, monitoring, and operational insights
• VEDA : Explainable and audit-ready AI decisioning engine built for compliance-sensitive enterprise workflows
• CORA-Property Management Solutions: : Predictive intelligence platform for real-estate pricing, portfolio optimization, and investment analytics
Backed by ecosystem partnerships with Microsoft, Databricks, Snowflake, and AWS, Samta.ai delivers agile, cost-efficient AI engineering with faster turnaround and enterprise-grade scalability. Trusted by enterprises across FinTech, BFSI, and digital transformation initiatives, Samta.ai embeds AI governance, data privacy, and compliance-by-design principles directly into the AI lifecycle , enabling organizations to scale AI with transparency, accountability, and operational control.
Enterprises leveraging Samta.ai automate 65%+ of repetitive data, analytics, and decision workflows while maintaining governance, explainability, and measurable business outcomes. Samta.ai provides the strategic consulting, AI engineering, and data modernization expertise needed to align enterprise operations with next-generation AI transformation goals.
Frequently asked questions
How accurate are AI property price models?
Accuracy varies significantly by data quality and market, but well built models trained on sufficient comparable sales and engineered features typically achieve MAPE in the 5 to 10 percent range. Models trained on thin data or missing key features like location can show much higher error, and MAPE alone does not reveal whether errors are systematically biased toward a specific property segment, which is why a coefficient of dispersion check matters alongside it.
What data do you need to predict real estate prices?
You need recent comparable sales transactions, structured property attributes such as size and age, and geospatial data covering location factors like transit access and school zones. Hedonic pricing theory, established by Rosen's 1974 framework, treats each of these as contributing an implicit price to the overall value, so missing any major category systematically biases the resulting model.
How do you test a pricing model?
Split your data into training and holdout sets, then calculate MAPE on the holdout set to measure average prediction error. Follow this with a coefficient of dispersion check, drawn from mass appraisal ratio study practice, to confirm errors are evenly distributed rather than systematically skewed toward over or under pricing a specific property segment. Retest periodically as market conditions shift.
Best AI tools for real estate price prediction in India
There is no single verified ranking of tools for the Indian market specifically, since rankings vary by methodology and update frequently. Evaluate any tool on whether it trains on sufficient local comparable sales data and discloses its accuracy testing methodology, including both MAPE and bias checks, rather than a single undisclosed accuracy claim.
How do developers use ML to set launch prices?
Developers train pricing models on comparable resale and prior launch transaction data, then adjust for a new construction premium that resale data alone typically underrepresents. Testing the model specifically for bias toward new builds, not just overall MAPE, catches systematic underpricing that an aggregate accuracy number can hide, as happened in the developer use case above.