

Summarize this post with AI
Most multi location businesses run a branch profitability analysis every quarter and still cannot say with confidence which locations are genuinely profitable versus which ones simply carry less shared cost. The two look identical on a standard report. A bank branch or a healthcare centre with low allocated overhead can appear more profitable than a busier location doing more real work, purely because of how shared costs get split. Getting branch and centre level profitability right is not a reporting problem, it is a cost allocation problem, and most standard financial reports were never built to solve it precisely.
Branch Profitability Analysis:
A branch profitability analysis that produces reliable results needs to allocate shared costs based on actual resource consumption at each location, not a flat ratio like revenue or headcount. Time driven activity based costing, developed by Harvard Business School's Robert Kaplan and Steven Anderson, allocates cost using only two inputs, the capacity cost rate of a resource and the time an activity actually takes, and has been validated extensively in peer reviewed healthcare research as more accurate than traditional overhead allocation methods. The same principle applies directly to bank branch profitability, where staffing time and transaction volume, not simple revenue share, should drive how shared costs are allocated across locations.
What centre level profitability analysis actually measures
Centre level profitability is not the same measurement as branch revenue or centre billing volume. It measures what remains after every cost genuinely attributable to that location, direct staffing, consumables, shared overhead, and allocated central costs, is subtracted from the revenue that location generated.
What is centre level profitability analysis in healthcare? It applies the same logic hospitals and clinic groups use to compare surgical pathways under time driven activity based costing, extended to an entire centre rather than a single procedure. Peer reviewed research on TDABC in orthopaedic and inpatient care has repeatedly found this approach surfaces cost variation that traditional ratio based costing methods mask entirely. Our guide on AI for finance covers how this same discipline applies on the banking side, where branch level cost allocation faces a structurally similar problem.
Measure Your AI Readiness with a Free Assessment
Why this matters more for multi location businesses in 2026
Location profitability analysis has become a genuine strategic priority for three reasons.
Shared cost allocation errors compound at scale. A multi branch bank or a multi centre hospital group with a dozen locations multiplies a single flawed allocation ratio across every location, meaning a small methodology error becomes a large strategic misjudgment.
Real time operational data has made accurate allocation achievable. Time driven activity based costing was historically labor intensive to build, but connecting live scheduling, staffing, and transaction data directly to a costing model removes most of that manual burden.
Margin pressure has made rough approximations too risky to rely on. A location wrongly flagged as unprofitable due to allocation error can trigger a real closure decision, while a genuinely underperforming location hidden by favorable allocation continues consuming resources unnoticed.
Our overview of data engineering ROI covers how the underlying data infrastructure investment behind accurate cost allocation pays for itself once decisions start being made on more reliable numbers.
How to build an accurate branch and centre profitability framework
Building a reliable multi location profitability view follows a consistent sequence, whether the locations are bank branches or healthcare centres.
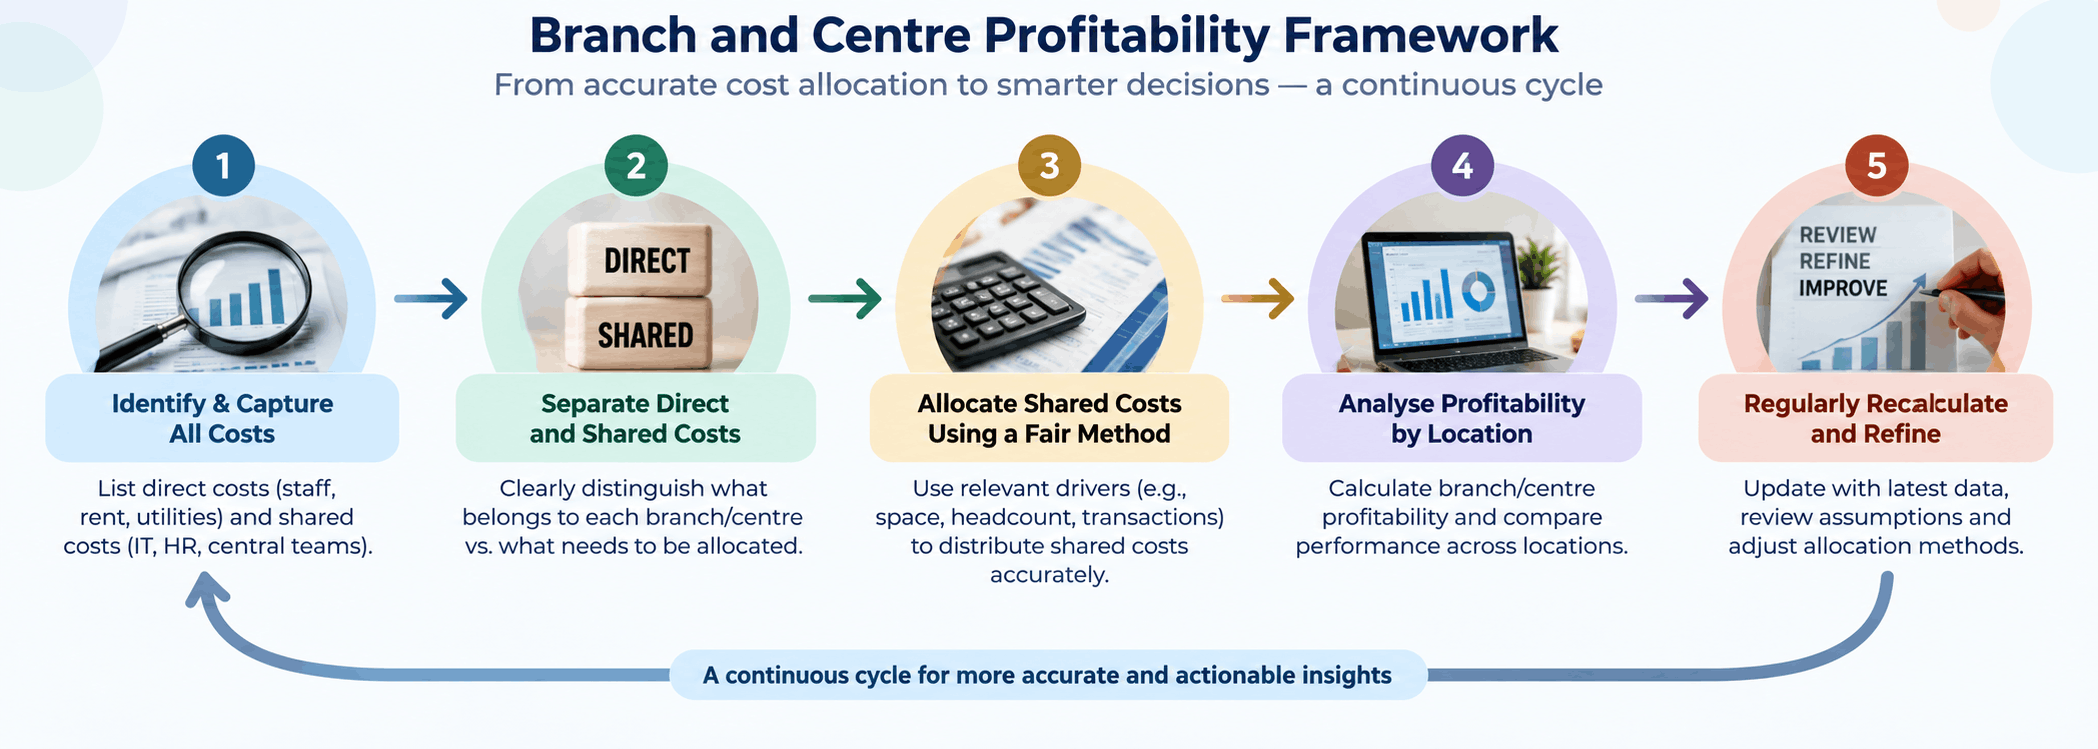
Separate direct costs from shared costs at each location. Direct costs, staff assigned to a single branch or centre, consumables used there specifically, are straightforward. Shared costs, central overhead, shared staff, and shared equipment, need a deliberate allocation method.
Choose a cost allocation basis grounded in actual resource use. Revenue or headcount ratios are simple but distort results. Time and capacity based allocation, the foundation of time driven activity based costing, reflects what each location actually consumes.
Establish capacity cost rates for shared resources. Determine the cost per minute or per unit of capacity for shared staff, equipment, and central functions, the same two input approach Kaplan and Anderson's methodology uses.
Apply consistent allocation rules across every location. A methodology applied inconsistently between branches or centres reintroduces the same distortion a better allocation basis was meant to remove.
Recalculate regularly as operational patterns shift. A location's true cost profile changes as staffing, patient or customer volume, and service mix evolve, meaning a static allocation calculated once quickly goes stale.
This is where the engineering execution layer matters. Samta.ai builds the VEDA AI decision analytics platform to connect live staffing, scheduling, and transaction data directly into a resource consumption based cost allocation model, integrating with existing Databricks, Snowflake, or Microsoft data infrastructure through our data integration consulting services. Institutions evaluating whether a general analytics platform can support this should see how VEDA compares to other data intelligence platforms, and the VEDA platform recalculates location level profitability continuously rather than as a periodic manual exercise. Our overview of AI powered insights platforms covers how this connects to the broader shift toward conversational, real time analytics across finance functions.
Cost allocation methods compared for branch and centre profitability
Costing Method | Cost Allocation Basis | Best For | Data Requirements | Key Limitation |
Direct cost only | Only costs directly traceable to a branch or centre | A quick, low effort initial view | Minimal, location level transaction data only | Ignores shared costs entirely, understates true differences between locations |
Simple overhead allocation | Shared costs split by a revenue or headcount ratio | Organizations needing a fast, approximate view | Revenue and headcount data by location | Can misrepresent an efficient location as unprofitable |
Traditional activity based costing | Costs allocated by actual activity consumption per location | Organizations with distinct cost drivers across locations | Detailed activity logs across all cost centers | Time and resource intensive to build and maintain |
Time driven activity based costing | Costs allocated using time estimates and resource capacity rates | Healthcare centres and bank branches with variable service mixes | Two inputs only, capacity cost rate and activity time estimates | Requires reliable time estimates per activity type |
AI driven dynamic cost allocation | Costs allocated continuously using live operational data | Multi location groups needing ongoing, not periodic, visibility | Integrated data across scheduling, staffing, and transaction systems | Requires upfront data integration investment |
Discover Where Your AI Models Are Most Exposed
Real world enterprise use cases
BFSI: a bank discovering two branches were misranked for years
A regional bank running its first resource consumption based reallocation discovered that two branches long assumed to be its weakest performers were actually profitable once shared costs were allocated by actual staffing time and transaction volume rather than a flat headcount ratio. Reviewing data engineering for BFSI helped the bank build the underlying data pipeline needed to sustain this more accurate allocation model going forward, rather than treating the discovery as a one time correction.
Healthcare: a hospital group comparing centres once staffing and consumable costs are included
A hospital group operating several outpatient centres applied time driven activity based costing to compare centre level profitability once nursing time, consumable costs, and shared equipment use were properly allocated. Supported by digital transformation managed services and workflow automation consulting, the group found that its highest revenue centre was actually its lowest margin once true resource consumption was factored in, reversing a long held assumption about where to invest next.
Key risks and failure modes
Using a single allocation ratio across structurally different locations. A flagship branch and a small satellite branch rarely consume shared resources proportionally to revenue or headcount alone.
Treating a one time cost allocation exercise as permanent. Staffing patterns, service mix, and patient or customer volume shift over time, and an allocation model calculated once becomes progressively less accurate.
Ignoring capacity cost rate differences between locations. A shared resource can cost meaningfully more per minute at one location than another, and a uniform rate assumption reintroduces distortion.
Making closure or investment decisions from a single quarter's data. Seasonal and cyclical variation can make a genuinely strong location look weak in an unrepresentative period.
Building a costing model too complex to maintain. Traditional activity based costing's data burden is well documented in the literature as a common reason implementations stall, which is part of why time driven variants were developed specifically to simplify the input requirements.
When to invest in a more rigorous allocation methodology
Invest in a more rigorous methodology when:
Your organization operates enough locations that a small allocation error compounds into a meaningful strategic misjudgment
Closure, expansion, or investment decisions are being made based on current profitability reports
Shared costs represent a significant share of total cost at each location
A simpler allocation approach may still be enough when:
The organization operates very few locations with broadly similar cost structures
Shared costs are a small proportion of total location level cost
No major location level investment or closure decisions are imminent
Reviewing Samta.ai's case studies alongside your own location portfolio gives a useful benchmark for how much a more accurate allocation model might change your current rankings.
Talk to an AI Expert About Your Business Needs

Conclusion
Branch profitability analysis built on a flat cost allocation ratio produces a ranking that reflects the allocation method more than actual location performance. Financial services and healthcare organizations that move to a resource consumption based approach, whether full time driven activity based costing or a continuously updated AI driven model, make location decisions based on what each branch or centre genuinely costs to run.
About Samta
Samta.ai is a Singapore-headquartered AI Product Engineering & Data Intelligence partner helping enterprises build production-grade AI systems for regulated and data-intensive environments.We help organizations move beyond experimentation by engineering scalable, explainable, and enterprise-ready AI solutions from data foundations and model development to workflow automation and deployment.
Our capabilities combine deep AI expertise, data engineering, and product engineering to deliver measurable business impact across FinTech, BFSI, cybersecurity, regulatory technology, and enterprise operations.
Our enterprise AI products power real-world intelligence systems:
• TATVA : AI-driven data intelligence platform for governed analytics, monitoring, and operational insights
• VEDA : Explainable and audit-ready AI decisioning engine built for compliance-sensitive enterprise workflows
• CORA-Property Management Solutions: : Predictive intelligence platform for real-estate pricing, portfolio optimization, and investment analytics
Backed by ecosystem partnerships with Microsoft, Databricks, Snowflake, and AWS, Samta.ai delivers agile, cost-efficient AI engineering with faster turnaround and enterprise-grade scalability. Trusted by enterprises across FinTech, BFSI, and digital transformation initiatives, Samta.ai embeds AI governance, data privacy, and compliance-by-design principles directly into the AI lifecycle , enabling organizations to scale AI with transparency, accountability, and operational control.
Enterprises leveraging Samta.ai automate 65%+ of repetitive data, analytics, and decision workflows while maintaining governance, explainability, and measurable business outcomes. Samta.ai provides the strategic consulting, AI engineering, and data modernization expertise needed to align enterprise operations with next-generation AI transformation goals.
Frequently asked questions
How do multi branch businesses calculate branch profitability?
Multi branch businesses calculate branch profitability by subtracting both direct and allocated shared costs from branch level revenue, with the accuracy of the result depending heavily on whether shared costs are allocated by actual resource consumption or a simpler ratio like revenue or headcount.
What is centre level profitability analysis in healthcare?
Centre level profitability analysis in healthcare measures what remains at each centre after direct costs, staffing, consumables, and allocated shared costs are subtracted from revenue, often using time driven activity based costing to allocate shared costs based on actual time and resource consumption.
How should shared costs be allocated across branches or locations?
Shared costs should be allocated based on actual resource consumption, using capacity cost rates and time estimates for shared staff and equipment, rather than a flat revenue or headcount ratio that can misrepresent how much a location genuinely relies on shared resources.
What analytics approach helps a multi branch financial services or healthcare company find its most profitable locations?
A resource consumption based costing approach connected to live operational data, staffing, scheduling, and transaction systems, helps identify true profitability by location, since it reflects actual cost drivers rather than a static, periodically calculated approximation.
How can a hospital group compare profitability across its centres once staffing and consumable costs are included?
A hospital group can apply time driven activity based costing, using capacity cost rates for nursing and clinical staff time alongside consumable costs per procedure, to compare centres on a consistent, resource consumption based methodology rather than revenue alone.