
Summarize this post with AI
A control tower that only shows where shipments are is a dashboard with a bigger budget. Gartner has noted that supply chain technology leaders mostly treat control towers as visual dashboards, and at times fail to use them as decision support tools. A logistics control tower earns its name only when an exception turns into a root cause and a routed action. This checklist walks through five stages, from tracking to learning, so you can test whether yours drives decisions.
Logistics control tower:
A logistics control tower is an integrated capability that combines people, process, data, organisation and technology to capture near real time operational data, give end to end visibility and support decisions on exceptions. Gartner cautions that visibility is only the first step, and that towers also need predictive analytics, recommended next actions and decision support. For logistics operators in Singapore and India running multi carrier, multi mode networks, the practical test is whether an alert leads to a root cause and a routed action, not whether the map looks good.
What is a logistics control tower?
A logistics control tower is a central capability that brings shipment, carrier, warehouse and cost signals into one place. It shows what is happening in near real time and supports decisions about what to do next. Gartner describes the supply chain version as a concept, not a single product. It is an integrated capability that can sit inside a broader supply chain platform or run as an intelligent data platform.
Related terms matter here. A supply chain control tower is the broader version spanning planning and inventory. A logistics visibility platform is the tracking layer, a control tower dashboard is the screen, and control tower analytics is the layer that explains and prioritises what the screen shows. Gartner lists six technology capabilities: continuous intelligence, advanced analytics, impact analysis, scenario modelling, collaborative response and AI. For the data foundation behind these, see logistics analytics platform basics and logistics decision analytics.
Bring AI-Powered Intelligence to Every Decision
Why this matters now for logistics teams
Three findings explain why dashboards alone keep disappointing.
Visibility is a foundation, not the finish line. Gartner has noted that many companies lack end to end visibility, process orchestration and aligned decision making. It also points out that towers remain functionally siloed in setup, and that data lakes are only a partial answer.
Analytics spend often fails to convert. Gartner found that eight in ten supply chain leaders investing in analytics are not realising the expected benefits. Disconnected data feeding a polished screen is a common cause.
AI is moving into logistics reporting. Gartner predicts that 25 percent of logistics KPI reporting will be supported by generative AI by 2028. That only works reliably on connected data, which is why building an AI ready foundation comes before the AI layer.
The control tower checklist: five stages from dashboard to decision
Gartner frames buy side control towers as "see, understand, act, learn." This checklist adds an explicit decision stage between understanding and act, since that is where most towers stall.
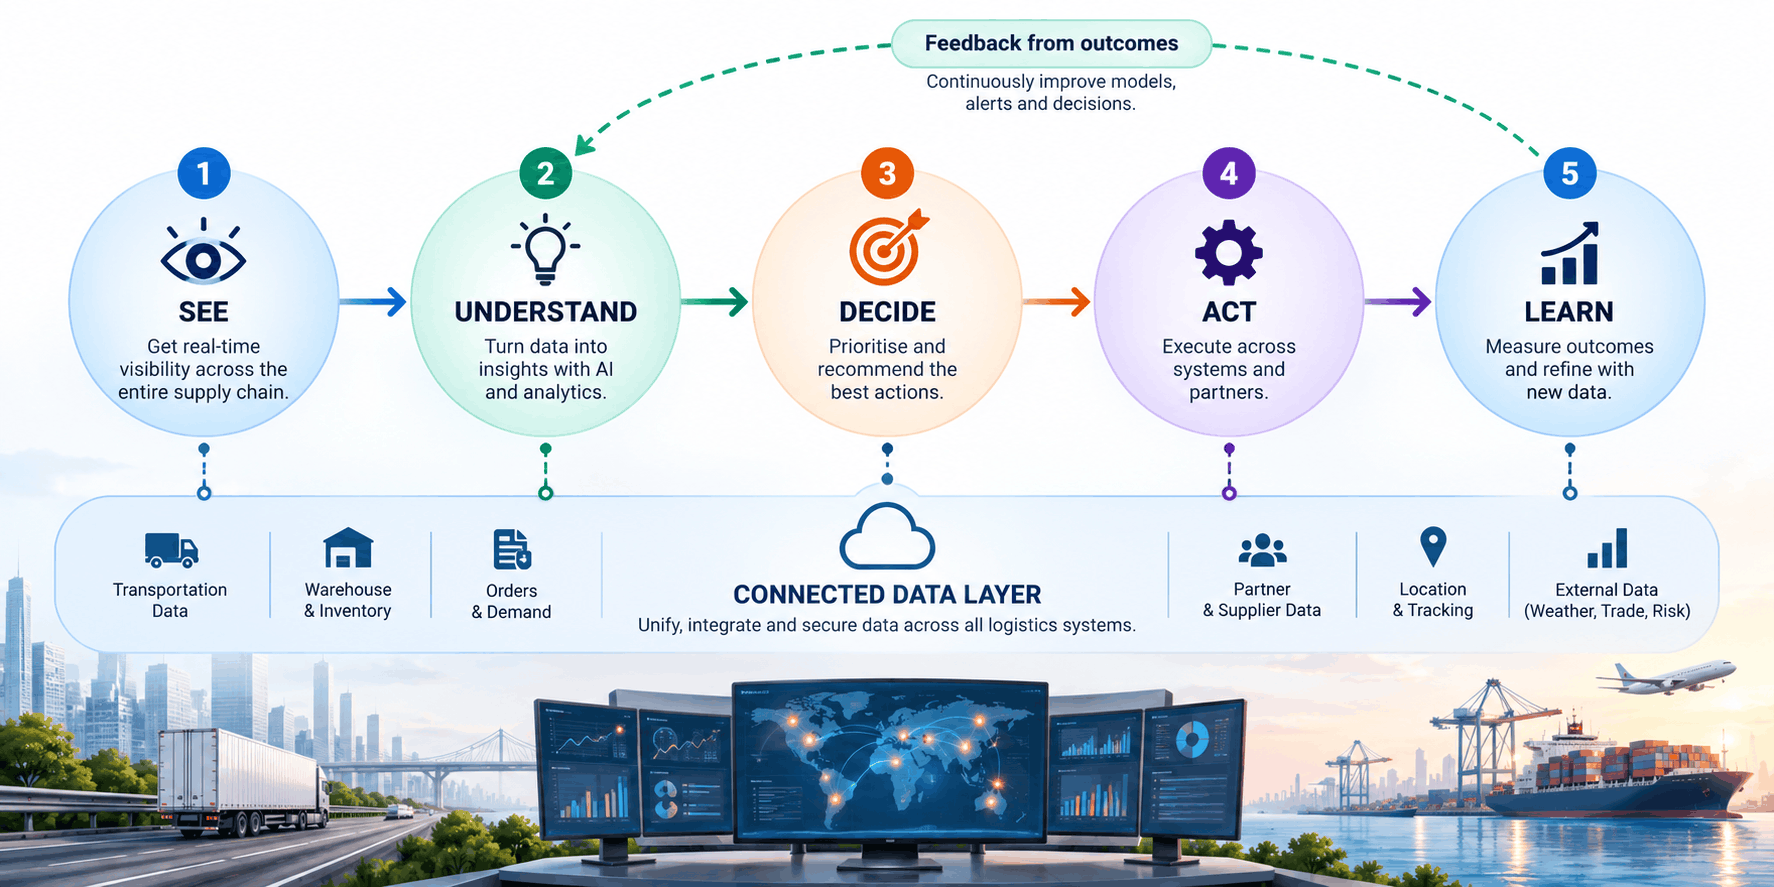
See: unified real time tracking. Real time tracking only helps when events from carriers, TMS, WMS and finance land in one model on shared shipment IDs. Check: can you see every active shipment, its status and its ETA in one place? Data integration consulting services cover this connection work on stacks such as Databricks, Snowflake or Microsoft.
Understand: exception alerts with root cause. Exception alerts should explain why, not just announce that something is late. An alert that cannot name a root cause, such as a handover delay, a port hold or a missing document, creates work instead of removing it. Check: does every alert carry a cause and an impact?
Decide: SLA monitoring and prioritisation. SLA monitoring ranks exceptions by customer commitment, penalty exposure and cost, so planners fix the right shipment first. Check: can you see which open exceptions threaten an SLA, and which can wait?
Act: decision workflows. Decision workflows route the chosen action, such as rebook, expedite or notify the customer, to a named owner with the right approvals. Workflow automation consulting builds these routes into the systems teams already use. Check: does a decision leave the tower as a task, or as an email?
Learn: close the loop. Record each decision and its outcome, so alert rules, carrier scores and thresholds improve over time. Check: do you review which actions actually worked?
Samta.ai's Veda platform and the Veda AI decision analytics product resolve operational questions directly from connected shipment, carrier and cost data. They act as the engineering execution layer for stages 2 to 4, and the approach is explained from business question to answer.
Comparing five approaches to a logistics control tower
Approach | Real time visibility | Root cause and exceptions | Decision workflows | Best fit |
Spreadsheets and carrier portals | Fragmented, manual refresh | Manual investigation by email and phone | None | Very low volume, single carrier |
TMS native tracking | Good within one system | Limited to that system's data | Basic, inside the TMS | Single system fleet and dispatch teams |
Build: data lake with a BI dashboard | Strong once data is joined | Depends on analyst effort | Usually none, visualisation focused | Teams with strong data engineering and clear reporting needs |
Buy: tower embedded in a broader supply chain platform | Strong, domain specific | Built in for the vendor's domain | Included for that domain | Enterprises standardised on one supply chain suite |
Decision analytics layer on connected data, for example VEDA | Near real time across connected sources | Resolved directly from joined shipment, carrier and cost data | Routed into existing workflows | Multi carrier networks needing decisions, not only visibility |
The build and buy rows follow Gartner's description of the two deployment routes. For a platform level comparison, see Veda versus a general Data Intelligence Platform.
Ready to Scale AI? Start with a Free Assessment
Real world use cases
Regulated industry: temperature sensitive healthcare cargo (illustrative scenario)
A 3PL moving temperature sensitive cargo receives excursion alerts from several systems. Each alert arrives, but nobody can tell quickly which excursions threaten a customer SLA or need regulatory documentation. Ranking alerts by SLA exposure and attaching a root cause lets the team act on the few that matter first. See documented examples in Samta.ai's case studies.
General enterprise: manufacturer drowning in alerts (illustrative scenario)
A manufacturer's inbound freight tower generates hundreds of alerts daily, and planners learn to ignore the channel. Real problems get lost among routine delays. Filtering to exceptions with SLA impact, and assigning each owner through a workflow, turns the alert stream back into a work queue. This is the engineering discipline described in enterprise AI engineering in Singapore.
Key risks and failure modes
Unclear span of control. Gartner warns that an overly broad scope creates unrealistic expectations about benefits.
Functional silos persist. A tower built on disconnected data inherits the same blind spots it was meant to remove.
Unclear data ownership. With many partners feeding data in, nobody agrees who owns, sees or benchmarks it.
Alerts without prioritisation. Volume without SLA ranking trains planners to ignore the system.
Build versus buy paralysis. Gartner notes that endless platform evaluation can block an investment decision.
No learning loop. Without recorded outcomes, rules and thresholds never improve.
When to invest in a decision ready control tower
Invest now if:
You run several carriers or transport modes and track them in separate places
Exceptions are handled by email and phone, not routed workflows
SLA penalties or customer commitments make late exceptions expensive
Dashboards exist, yet planners still chase status manually
Hold off, or fix the basics first, if:
You use a single carrier on simple lanes
Shipments lack shared IDs across systems, so integration comes first
Nobody owns exception handling, so an alert would have no recipient
Buyers searching for a control tower platform india should apply the same test: connect the data first, then judge the tool on root cause and routed action.
Assess Your AI Model Risk with Confidence
Conclusion
A control tower that shows shipments but cannot explain or resolve exceptions is a dashboard. The five stages above, see, understand, decide, act and learn, turn it into a decision tool. Run the checklist against your current setup and find the stage where work still moves back to email and calls. Fix that stage first. The next step is testing it on your own shipment data.
About Samta
Samta.ai is a Singapore-headquartered AI Product Engineering & Data Intelligence partner helping enterprises build production-grade AI systems for regulated and data-intensive environments.We help organizations move beyond experimentation by engineering scalable, explainable, and enterprise-ready AI solutions from data foundations and model development to workflow automation and deployment.
Our capabilities combine deep AI expertise, data engineering, and product engineering to deliver measurable business impact across FinTech, BFSI, cybersecurity, regulatory technology, and enterprise operations.
Our enterprise AI products power real-world intelligence systems:
• TATVA : AI-driven data intelligence platform for governed analytics, monitoring, and operational insights
• VEDA : Explainable and audit-ready AI decisioning engine built for compliance-sensitive enterprise workflows
• CORA-Property Management Solutions: : Predictive intelligence platform for real-estate pricing, portfolio optimization, and investment analytics
Backed by ecosystem partnerships with Microsoft, Databricks, Snowflake, and AWS, Samta.ai delivers agile, cost-efficient AI engineering with faster turnaround and enterprise-grade scalability. Trusted by enterprises across FinTech, BFSI, and digital transformation initiatives, Samta.ai embeds AI governance, data privacy, and compliance-by-design principles directly into the AI lifecycle , enabling organizations to scale AI with transparency, accountability, and operational control.
Enterprises leveraging Samta.ai automate 65%+ of repetitive data, analytics, and decision workflows while maintaining governance, explainability, and measurable business outcomes. Samta.ai provides the strategic consulting, AI engineering, and data modernization expertise needed to align enterprise operations with next-generation AI transformation goals.
Frequently asked questions
What is a logistics control tower?
A logistics control tower is a central capability that combines shipment, carrier, warehouse and cost data to show what is happening in near real time and support decisions about exceptions. Gartner describes the supply chain version as a combination of people, process, data, organisation and technology, not a single application. Its value lies in decisions, not just visibility.
What should a control tower dashboard show?
A control tower dashboard should show every active shipment with status and ETA, open exceptions ranked by SLA exposure, the likely root cause of each, and the owner and next action. Maps and counts are useful, but a dashboard that stops at status leaves planners to find causes and choose actions manually.
Why do dashboards not lead to decisions?
Because visibility is only the first step. Gartner notes that leaders mostly treat control towers as visual dashboards and at times fail to use them as analytics driven decision support tools. Without root cause analysis, prioritisation and routed actions, a dashboard tells people what happened and leaves the decision, and the delay, with them.
Best logistics control tower software in India
There is no single verified ranking of logistics control tower software in India, since rankings vary by method and change often. Evaluate any product on whether it connects your carrier, TMS and finance data, explains the root cause of each exception, routes actions into existing workflows, and records outcomes. Test it on your own shipment data before you commit.
How AI turns a logistics dashboard into decisions
AI can rank exceptions by SLA and cost impact, suggest likely root causes by comparing patterns across carriers and lanes, and let teams ask questions in plain language instead of building a new report. Gartner expects generative AI to support a quarter of logistics KPI reporting by 2028, but it works reliably only on connected, consistent data.