
Summarize this post with AI
Most logistics heads start Monday morning with the same five questions, and most still answer them by pulling three spreadsheets and guessing at the gaps. Logistics decision analytics exists to answer these questions directly from shipment data, without the manual pull. This piece covers the five questions, what data answers each one, and where a decision analytics layer like VEDA changes the Monday routine.
Logistics decision analytics:
Logistics decision analytics resolves recurring operational questions, on time delivery, freight cost per shipment, carrier performance, lane profitability and exception volume, directly from connected shipment data rather than manually assembled reports. Gartner predicts that 25 percent of logistics KPI reporting will run on generative AI by 2028, which only works reliably when shipment, carrier and cost data are already integrated. For logistics heads in Singapore and the wider APAC region, the practical benefit is getting these five answers before the Monday operations meeting starts, not after it.
What is decision analytics in logistics?
Logistics decision analytics is the practice of resolving a specific operational question, not just displaying a dashboard, directly from connected shipment, carrier and cost data. This differs from a general logistics kpi dashboard, which displays predefined metrics that still need to be interpreted. Decision analytics answers the actual question a logistics head is asking that morning.
Related terms include shipment data analytics, the underlying practice of structuring and analysing shipment level records, and supply chain decision intelligence, the broader category covering planning and procurement decisions alongside logistics operations. For a deeper breakdown of this category shift, see logistics analytics platform fundamentals and from business question to answer, the broader model this approach is built on.
Transform Business Data Into Actionable Decisions
Why this matters now for logistics teams in Singapore
Three developments make this an active priority in 2026.
GenAI reporting is becoming standard, but only works on integrated data. Gartner predicts that 25 percent of logistics KPI reporting will run on generative AI by 2028, based on a survey where half of supply chain leaders planned GenAI adoption within a year.
Most supply chain analytics investment still underdelivers. Gartner also found that eight in ten supply chain leaders investing in analytics are not realising the expected benefits, which points to fragmented data feeding the analytics layer, not weak tools.
Regional digitalisation is accelerating the baseline expectation. Singapore has set a target for 40 percent of logistics SMEs to adopt at least one digital solution by 2025 under the refreshed Logistics Industry Transformation Map. For the data foundation this depends on, see AI ready data engineering and enterprise AI engineering in Singapore.
The 5 questions, answered directly from shipment data
Here are the questions logistics heads actually ask, and what data resolves each one.
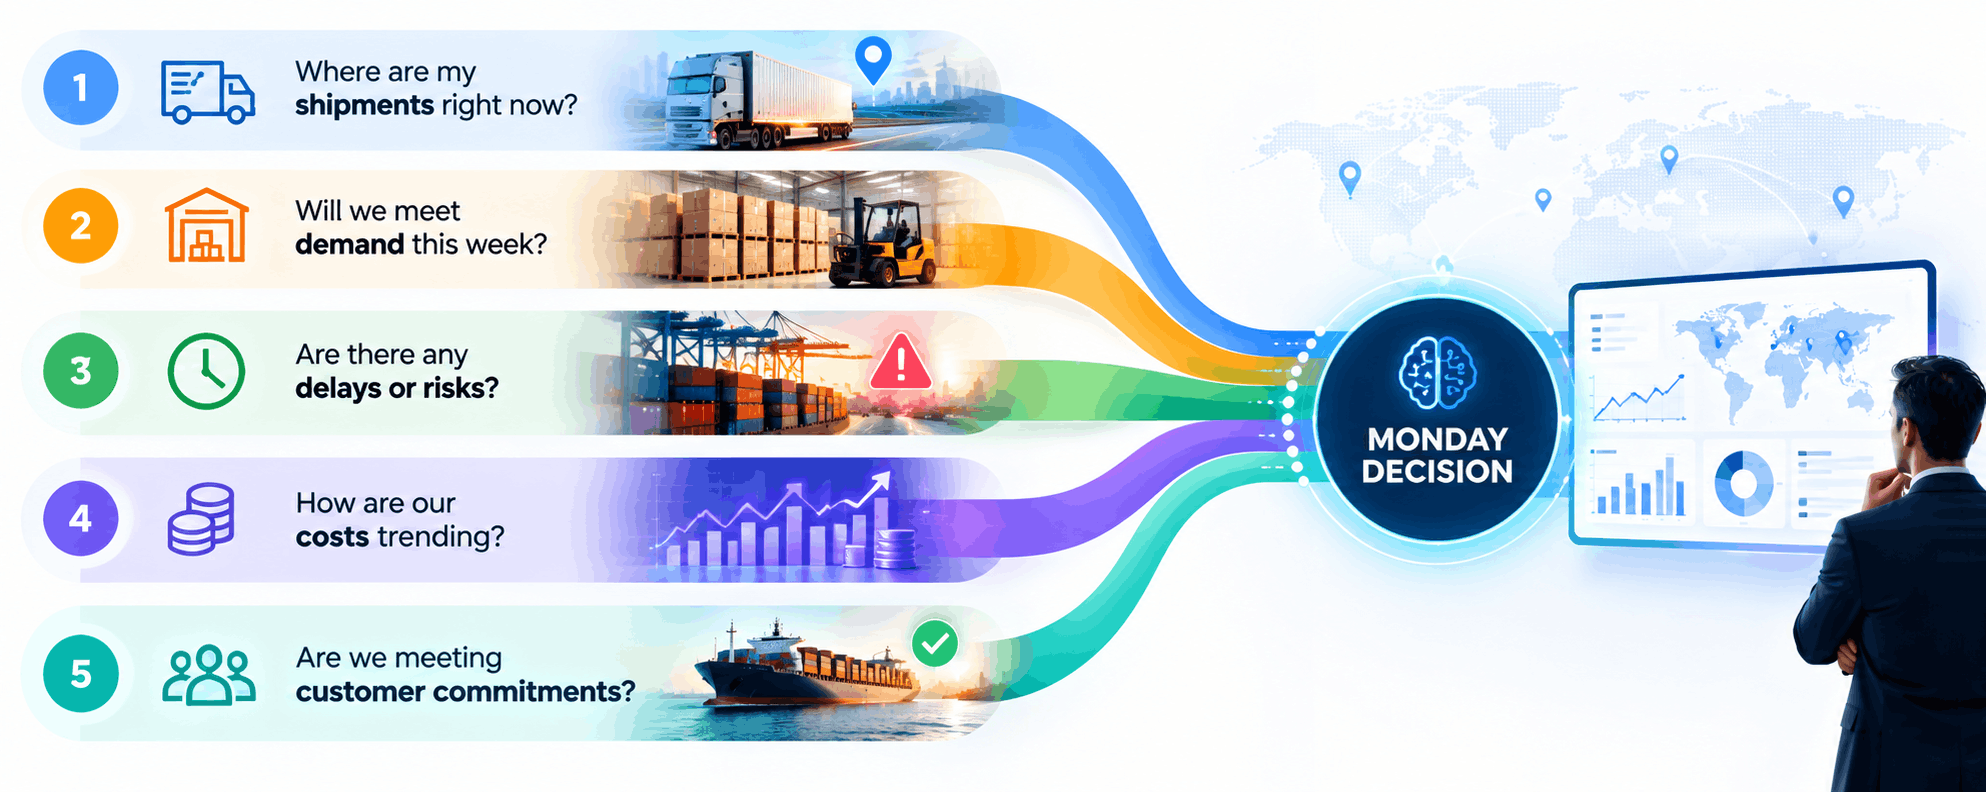
Which shipments missed on time delivery last week, and why?
This resolves against on-time delivery records joined with exception codes, not a single aggregate percentage. The aggregate number hides which lanes or carriers are actually driving the miss.
What was our freight cost per shipment, and is it trending up?
This resolves against freight cost per shipment data broken out by lane and carrier, since a rising average often hides one specific lane absorbing the increase while others stay flat.
Which carriers are underperforming this month?
This resolves against carrier performance scorecards combining on time rate, cost and exception frequency, not a single metric viewed in isolation.
Which lanes are actually profitable once real cost is allocated?
This resolves against lane analysis joining route level cost, revenue and volume, revealing which lanes look fine on total revenue but lose money once allocated cost is applied properly.
How many shipments have an exception still open, and what caused them?
This resolves against proof of delivery records and exception management logs, giving a current, not historical, view of unresolved issues.
Samta.ai's Veda platform and the Veda AI decision analytics product resolve these five questions directly in plain language, built on top of data integration consulting services work that connects TMS, WMS and carrier data underneath. This is the engineering layer that makes a same morning answer possible, rather than a report built days later.
Comparing five ways to answer weekly logistics questions
Approach | Answers all 5 questions | Data freshness | Manual effort each week | Best fit |
Manual spreadsheet pull | Partial, inconsistent | Stale, as of last export | Very high | Small operations teams, low shipment volume |
TMS native report | Partial, routing data only | Near real time within TMS | Medium, no cost or carrier join | Single system fleet management |
General BI dashboard | Partial, needs interpretation | Scheduled, often daily | Medium, dashboard still needs reading | Teams already standardised on one BI tool |
Generic AI chatbot on exported data | Partial, ungoverned | Stale, as of last export | Low, but risk of wrong answers | Quick, low stakes exploration only |
Logistics decision analytics platform, for example VEDA | Full, all 5 answered directly | Near real time, connected sources | Lowest, no manual pull needed | Logistics heads needing same morning answers |
Only the last row resolves all five questions directly, without manual joining. For a platform level comparison, see Veda versus a general Data Intelligence Platform.
Measure Your AI Readiness with a Free Assessment
Real world use cases
Regulated freight angle: customs brokerage exception backlog
A customs brokerage handling regulated cargo could not answer, in real time, how many shipments had an open compliance exception at any given moment. The answer always lagged by a day or more, reconstructed from separate logs. Connecting exception and proof of delivery data directly answered question 5 the same morning, giving compliance staff a current view rather than a historical reconstruction. See related delivery patterns in Samta.ai's case studies.
General enterprise: 3PL discovering an unprofitable lane
A 3PL's total revenue looked healthy, but nobody could answer question 4 directly, which specific lanes were actually profitable once real cost was allocated. Finance reported company wide margin only. Lane level analysis revealed two lanes operating at a loss once fuel and labour cost were properly allocated, a renegotiation conversation that had been invisible in the aggregate numbers for months.
Key risks and failure modes
Answering with aggregates instead of specifics. A single on time delivery percentage hides which lane or carrier is actually driving the miss.
Carrier scorecards built on one metric alone. Cost without on time rate, or on time rate without exception frequency, gives an incomplete performance picture.
Lane profitability calculated without proper cost allocation. Spreading cost evenly across all lanes hides which specific lanes are actually unprofitable.
Exception data siloed from proof of delivery records. Without joining these, exception counts cannot be verified against actual delivery outcomes.
Treating these five questions as a one time report instead of a weekly habit. Data that answered Monday's question accurately can be stale by the following week without a connected, refreshed source.
Feeding GenAI reporting tools disconnected exported data. This produces confident, fluent answers that are wrong, since the underlying join never happened correctly.
When to invest in logistics decision analytics, and when not to
Invest now if:
Your team spends real time each Monday manually pulling and reconciling these five questions
You operate more than one source among TMS, WMS, carrier systems and finance
Leadership regularly disputes which lanes or carriers are actually underperforming
You are piloting GenAI reporting and need the underlying data connected first
Hold off if:
Your shipment volume is too low for lane or carrier level analysis to be statistically meaningful
You operate a single integrated TMS that already answers most of these questions natively
You have not yet connected your core systems, in which case data integration comes first
Know Your AI Model Risk Before You Scale
Conclusion
The same five questions come up every Monday because they are the right questions. The problem has never been what to ask, it has been how long it takes to get a real answer. Connecting shipment, carrier and cost data directly closes that gap. The next step is seeing your own data answer these five questions in minutes, not hours.
About Samta
Samta.ai is a Singapore-headquartered AI Product Engineering & Data Intelligence partner helping enterprises build production-grade AI systems for regulated and data-intensive environments.We help organizations move beyond experimentation by engineering scalable, explainable, and enterprise-ready AI solutions from data foundations and model development to workflow automation and deployment.
Our capabilities combine deep AI expertise, data engineering, and product engineering to deliver measurable business impact across FinTech, BFSI, cybersecurity, regulatory technology, and enterprise operations.
Our enterprise AI products power real-world intelligence systems:
• TATVA : AI-driven data intelligence platform for governed analytics, monitoring, and operational insights
• VEDA : Explainable and audit-ready AI decisioning engine built for compliance-sensitive enterprise workflows
• CORA-Property Management Solutions: : Predictive intelligence platform for real-estate pricing, portfolio optimization, and investment analytics
Backed by ecosystem partnerships with Microsoft, Databricks, Snowflake, and AWS, Samta.ai delivers agile, cost-efficient AI engineering with faster turnaround and enterprise-grade scalability. Trusted by enterprises across FinTech, BFSI, and digital transformation initiatives, Samta.ai embeds AI governance, data privacy, and compliance-by-design principles directly into the AI lifecycle , enabling organizations to scale AI with transparency, accountability, and operational control.
Enterprises leveraging Samta.ai automate 65%+ of repetitive data, analytics, and decision workflows while maintaining governance, explainability, and measurable business outcomes. Samta.ai provides the strategic consulting, AI engineering, and data modernization expertise needed to align enterprise operations with next-generation AI transformation goals.
Frequently asked questions
What KPIs should a logistics head review weekly?
The core set includes on time delivery rate by lane and carrier, freight cost per shipment trended over time, carrier performance scorecards combining cost and reliability, lane level profitability after proper cost allocation, and open exception volume with root cause. Reviewing these as isolated averages rather than broken out by lane or carrier hides where the actual problems sit.
How do you analyse shipment data?
Join shipment records with delivery timestamps, cost allocation, carrier identifiers and exception codes on shared shipment and lane identifiers. This joined view, rather than any single system's native report, is what reveals patterns like a specific lane driving cost increases or a specific carrier driving on time delivery misses. Data quality and consistent keys across systems matter more than the analysis method itself.
What is decision analytics in logistics?
Decision analytics resolves a specific operational question directly from connected data, rather than displaying a dashboard that still needs interpretation. Asking which lanes are unprofitable and getting a direct, traceable answer is decision analytics. Viewing a lane profitability chart and determining that yourself is a dashboard. The distinction matters because decision analytics removes the interpretation step entirely.
Which analytics platform answers logistics KPI questions in plain English?
A platform built around natural language queries resolved against connected shipment, carrier and cost data, rather than requiring a predefined report for each question. VEDA is built specifically around this model, resolving questions like lane profitability or carrier performance directly rather than requiring a dashboard to already exist for that exact question.
How can AI help a logistics manager decide weekly priorities?
AI can surface which lanes, carriers or shipments need attention first by resolving multiple questions, on time delivery, cost trend, exception volume, simultaneously rather than one report at a time. This turns a Monday routine of manual data pulling into a few minutes of direct questions, freeing time for the actual operational decisions that follow.
Unlock Verifiable Insights Across All Data Stores
VEDA connects siloed data sources and empowers business leaders with real-time, governed AI decision analytics.
Explore VEDA Platform >